Summary: the Arctic Oscillation was an important player in widespread Northern Hemisphere winter warmth, but the hemispheric temperature-AO relationship is not simple.
Arctic Oscillation (AO) in 2019/2020
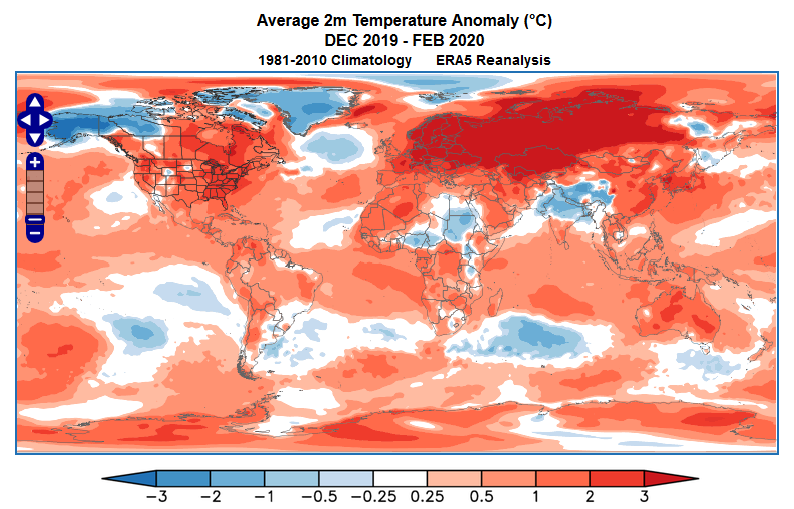
The Northern Hemisphere winter of 2019-2020 was extraordinarily warm for nearly all of the major energy demand centers of Europe, Asia, and North America. The map below, showing the departure from normal of the December-February average temperature, reveals that the majority of Eurasia’s vast land area was flooded with unusual warmth of 2-3°C or more above the 1981-2010 normal. Eastern Asia and most of North America (with the notable exception of Alaska) were also far warmer than normal.
The World Climate Service has developed a powerful data mining system that enables users to quickly explore the impact of the Arctic Oscillation, and many other indices, by phase for each month of the year, showing impacts on all the major weather variables all around the globe. The maps featured in this article can be produced in just a few clicks of the mouse.
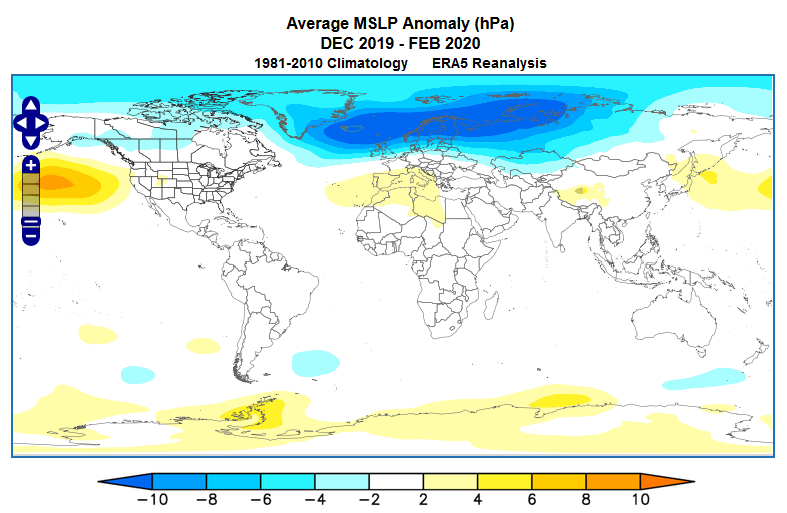
The immediate cause of the excessive warmth was a very strong and persistent positive phase of the Arctic Oscillation, which is a measure of the pressure difference between the Arctic and the mid-latitudes. In a positive Arctic Oscillation regime, a strong pressure gradient keeps cold air “locked up” near the pole rather than allowing it to spill south, and perhaps just as importantly, strong westerly flow causes warm Atlantic air to sweep across interior Eurasia, where the continental winter is usually very cold. Here’s the departure from normal of the mean sea level pressure this winter.
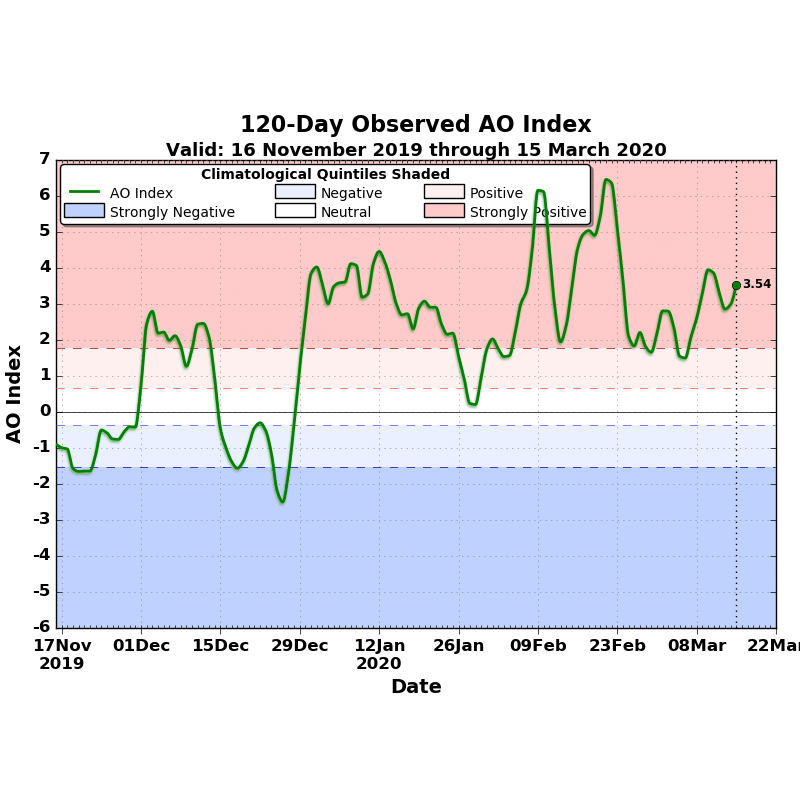
The Arctic Oscillation became especially positive in late winter, with the daily index breaking the all-time positive AO index record in late February.
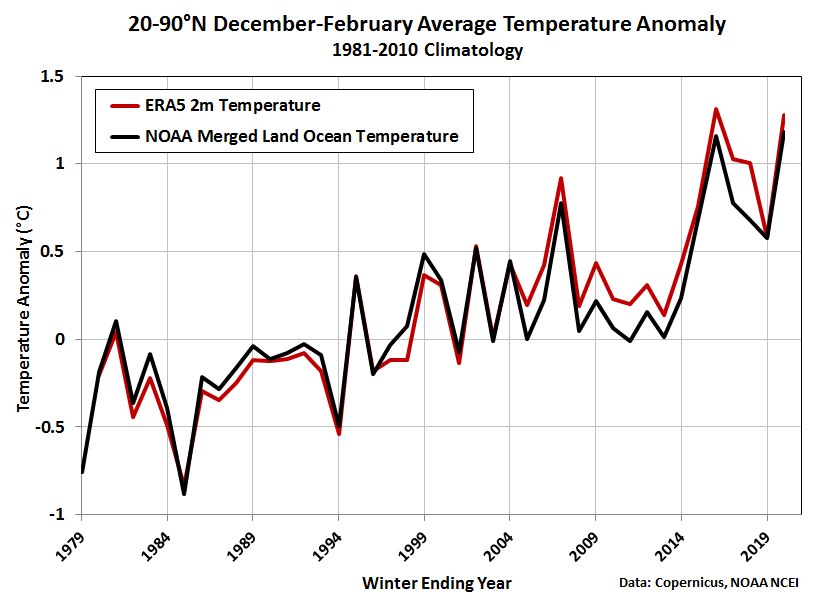
On a hemisphere-wide basis, area-average winter temperatures north of 20°N were very close to the modern record set in winter 2015-2016, which is when the last strong El Niño event occurred. El Niño always pumps excess heat into the atmosphere and produces a spike in global mean temperatures; but this winter we only had a very weak El Niño. The chart below shows Dec-Feb 20-90°N average temperatures, relative to normal, from two different data sets: NOAA’s global analysis based on land and sea surface observations, and the ERA5 reanalysis.
The positive AO phase has been cited widely as one of the causes of the unusual hemispheric warmth this winter, and this makes sense when we see the enormous thermal anomaly over Eurasia in the map above. But does the historical data show a connection between the AO and hemispheric temperatures? The answer is yes, but it’s not a strong connection.
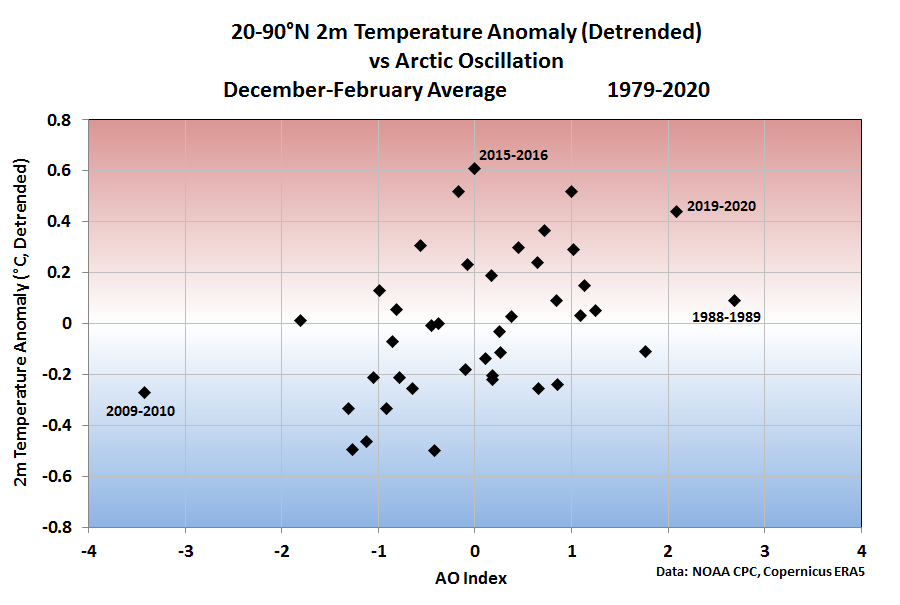
The chart below shows Dec-Feb mean values of the Arctic Oscillation index versus 20-90°N temperature, after removing the long-term trend in temperature; this is for the winters of 1979-80 through 2019-20. There’s a modest and statistically significant correlation coefficient of +0.43, but it’s far from a strong relationship. For example, winter 2015-16 was the warmest on record, but the AO was perfectly neutral overall that winter. Another extreme winter was 1988-89, which saw the most intensely positive AO regime on record, but the hemispheric temperature was only marginally higher than trend.
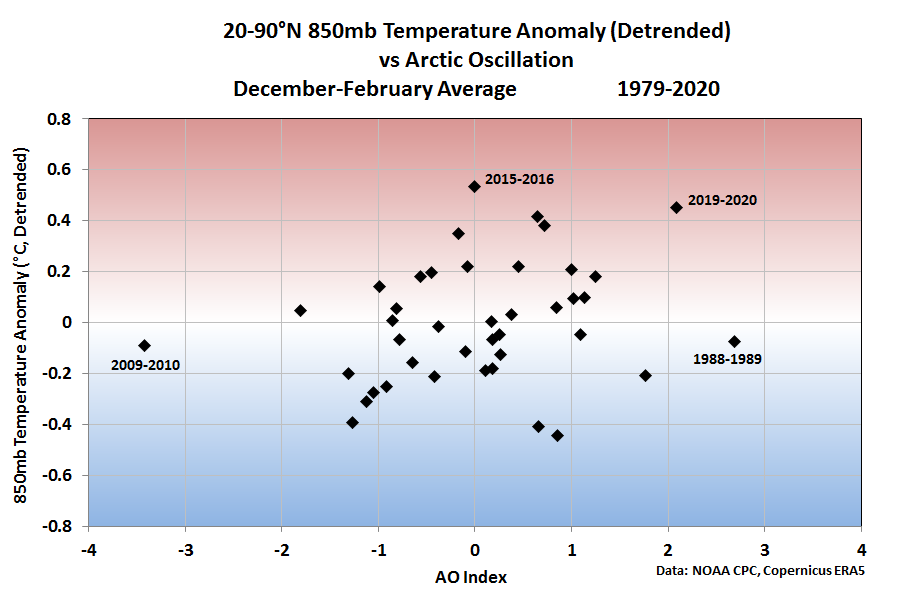
The plot thickens a little more when we look at temperatures in the lower atmosphere rather than at the surface; for example, below is the scatter plot for the AO versus 850mb temperature (about 4000-5000 feet above sea level). Prior to this winter, the correlation was an insignificant +0.17, and the two opposite ends of the AO spectrum (2009-10 and 1988-89) had virtually identical temperature anomalies (relative to trend).
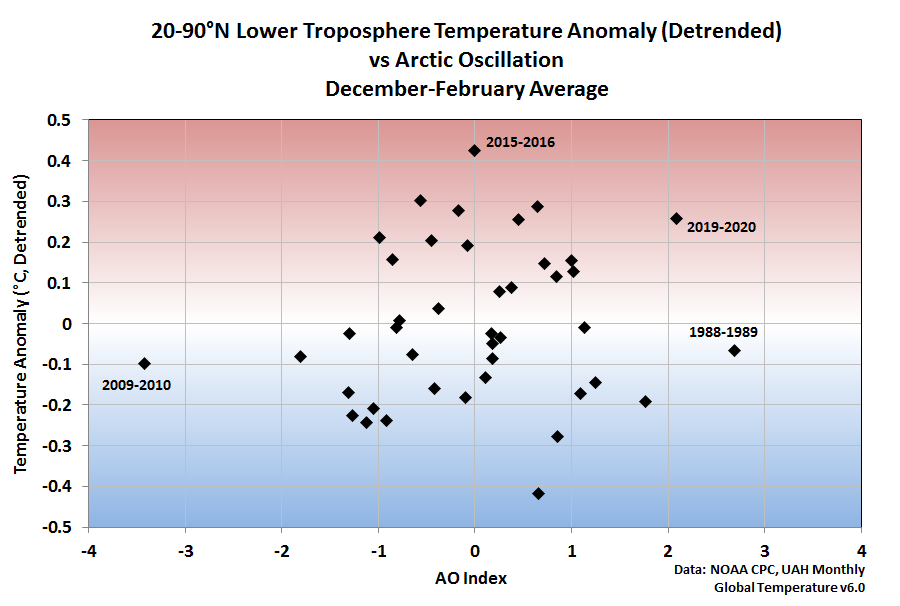
The absence of correlation in the free atmosphere above the surface is confirmed when we use satellite-derived lower tropospheric temperatures: see below. In this case the correlation is a miniscule +0.07 prior to 2019-20.
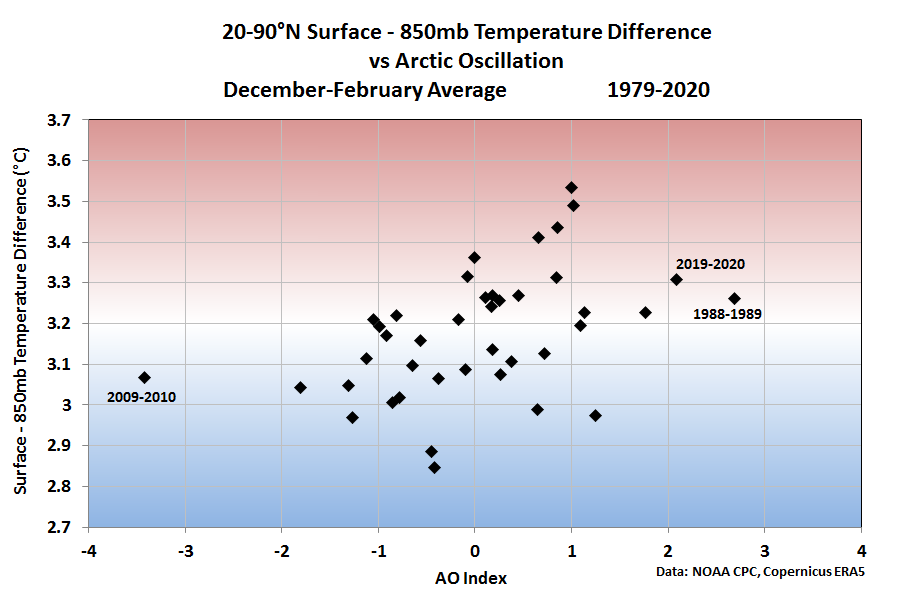
So how can this be explained? It seems that the AO phase affects surface temperatures more than temperatures in the lower atmosphere. The chart below illustrates this: there’s a positive correlation between the AO index and the vertical temperature difference from the surface to 850mb. This winter the AO was strongly positive, and the area-average vertical temperature difference (lapse rate) was somewhat higher than normal.
Here’s what the normal December-February surface-850mb temperature difference looks like on a map.
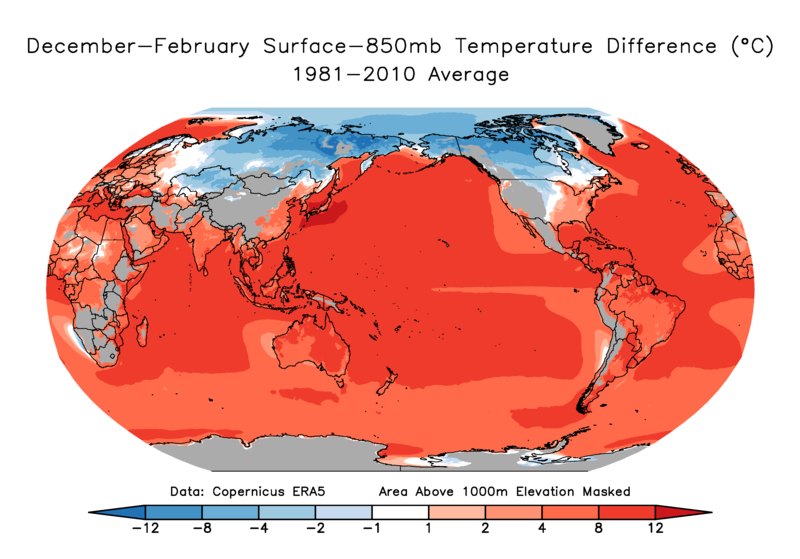
Of course, the elevation of the land is near or above 850mb in some parts of the world, so I’ve masked out areas with elevation over 1000m above sea level. In the rest of the world, large positive lapse rates usually prevail over ocean (with very few exceptions outside the Arctic), but in the interior continental regions of the north there is a semi-permanent temperature inversion during winter. This is an inevitable consequence of having winter-long snow cover and little or no solar heating to overcome the continuous radiation loss at the surface.
What about this winter? The map below shows the departure from normal of the same surface-850mb temperature difference in the past few months.
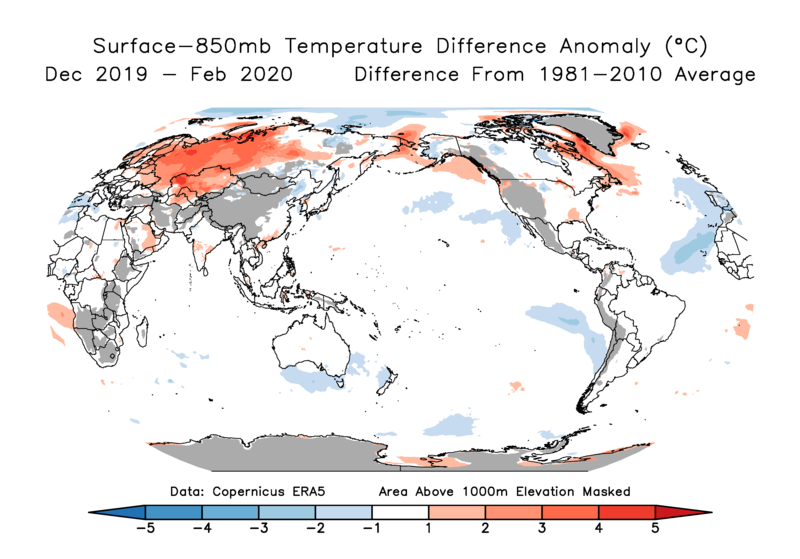
The main feature is obviously the excess surface warmth over western and central Russia, which reflects the maritime nature of the air that was persistently transported eastward across the continent. Not only did a mild westerly wind blow through most of the winter, but the increased warmth and humidity aloft (and presumably fewer calm, clear days) prevented temperatures from dropping off at the surface as they usually do (via radiation imbalance). The details of the physics would make for an interesting study, but it seems clear that central Eurasia holds the key to the relationship between hemispheric average lapse rate and the AO phase.
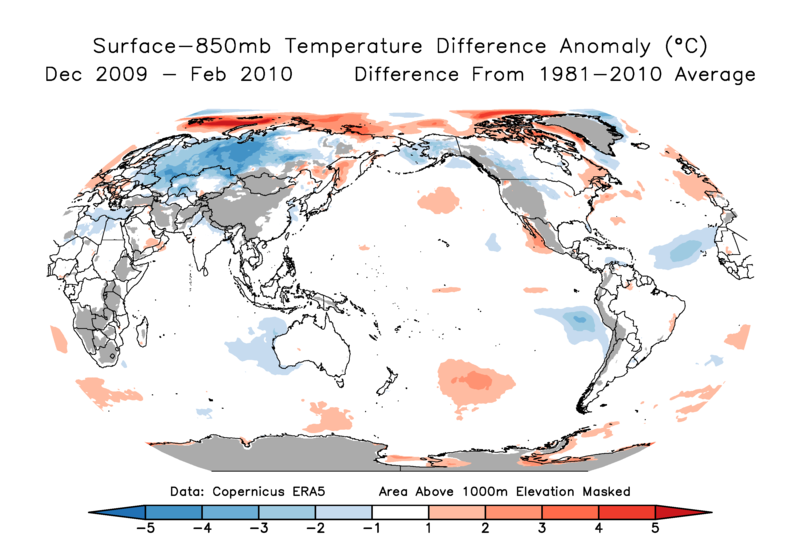
To round off the discussion, here’s the same map for the Northern Hemisphere winter of 10 years ago, when the AO was strongly negative. Not only was central Eurasia colder than normal owing to a lack of westerly flow that winter, but the cold at the surface was amplified by stronger temperature inversions than normal.
In conclusion, an interesting observation emerges: the Arctic Oscillation has very little net effect on Northern Hemisphere average temperatures above the surface, but the physics of winter climate over Eurasia dictate that hemispheric-average surface temperatures do show a response to the AO. It’s a fascinating world of climate, and there’s always something new to learn.