As the science of long-range forecasting matures and evidence of real-world success accrues (see, for example, verification of East Asian and European seasonal forecasts), new applications of subseasonal and seasonal forecast information are constantly emerging. Traditionally, long-range forecasts for the energy industry have focused on expected variations in energy demand due to (mainly) temperature fluctuations, but energy supply is becoming more and more sensitive to weather and climate owing to the increasing importance of generation from renewable sources.
In recent weeks, the World Climate Service has extended existing capabilities to provide long-lead forecasts for specific wind farm installations. The first question asked by the customer is often, “How good are the forecasts?“, and so a critical part of the product development process is an examination of forecast performance.
Forecast Performance for UK Offshore Wind Farms
One of the most basic measures of forecast skill is the correlation between forecast values and observed values, and this simple metric can be used for long-lead forecasts when they are measured in a non-probabilistic format (i.e. a single forecast value for a specific location and period). The chart below shows an example of single-value monthly forecasts of 100m wind speed at an Irish Sea wind farm location for lead times of 1-3 months (the Irish Sea is a key region for United Kingdom offshore wind power). The forecast data is obtained from a World Climate Service calibrated multi-model blend, and “observed” is from the ERA5 reanalysis. Both forecast and observed are converted into “anomaly,” i.e., the departure from the long-term normal.
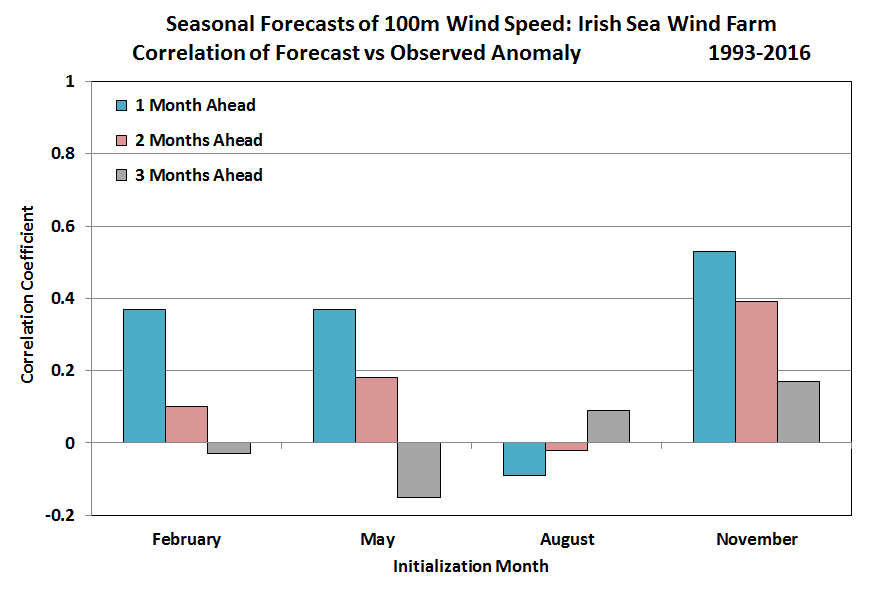
Except for the forecasts initialized in August, there is a modest degree of skill (correlation ~ 0.4-0.5) in the first month (e.g. November for December). The second month also performs reasonably well in November (i.e. November for January).
If we average together the forecasts for months 1-3 and look at the seasonal mean wind speed, here’s what the single-value forecasts and corresponding verification look like on a scatter diagram; the November 2019 forecast is included as well.
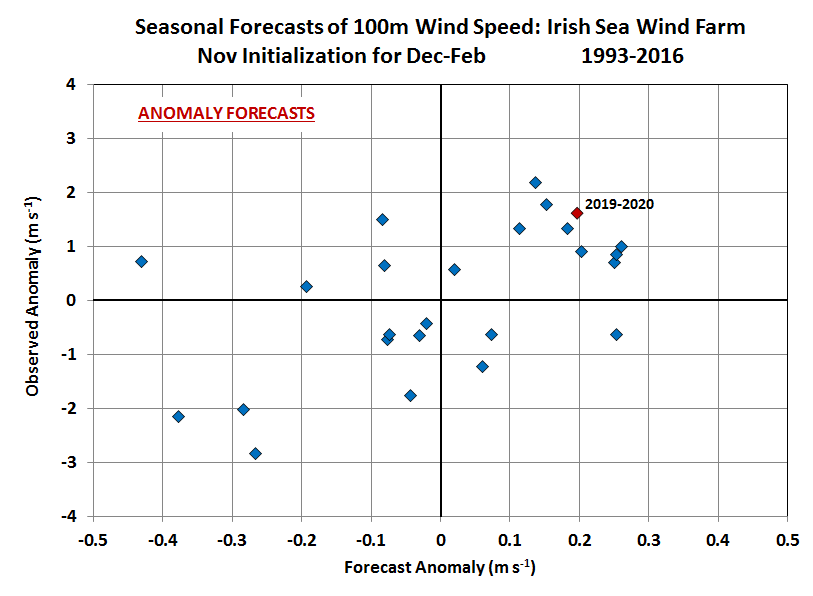
Clearly this is good news in the sense that the forecasts are “right” more often than they are “wrong”; there is unquestionably some skill and the forecasts “should” be valuable.
However, the value of these single-value anomaly forecasts is severely limited in practice, because the user does not know when to act on the forecast. For those in the know, a forecast wind speed of 0.2 m/s above normal is quite significant in November based on the historical performance, but in the context of observed variations from -3 to +3 m/s, the forecast signal looks terribly weak and inconsequential. Moreover, without the additional information about past performance, the user cannot know whether the forecast is skillful or not; a forecast wind speed anomaly of 0.2 m/s in August would be meaningless, because the forecasts have no skill at that time of year.
Probability Forecasts
The critical next step that translates the forecast into actionable information is to create a probability forecast. If the probability is calculated correctly, then it provides a true (“reliable”) estimate of the chance that an outcome will occur, for example the chance that the Dec-Feb 100m wind speed will be above the long-term mean.
Here’s what the probability forecasts look like from the same data as above:
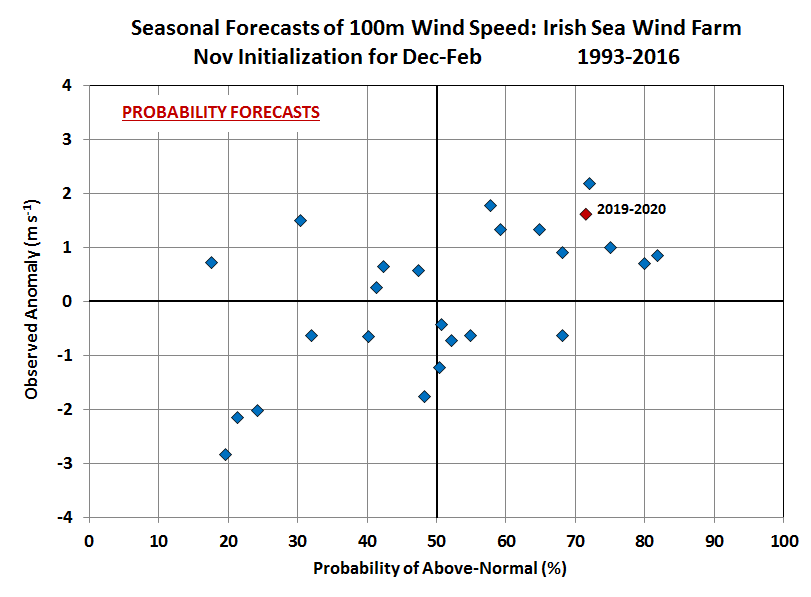
The significance of each year’s forecast signal is now immediately clear. In some years, such as 2019, the probability is quite high that the wind will be above or below normal, and clearly the higher-probability forecasts tend to be correct (but not always, of course). In contrast, many years have weak forecast signals that produce a near-neutral balance of probabilities.
At the risk of being repetitive, the key advantage of the probability information is that it allows the user to make a decision. Users know the costs of taking action based on a forecast, and they know the consequences of the alternative outcomes if the forecast is right or wrong. Users also know the long-term cost and consequences of inaction (“business as usual”). Armed with this information, users can determine the level of confidence they need to make the correct decision; and a probability forecast provides the critical final input at the time of decision.
For more discussion of these ideas, see earlier blog posts, including “Making Sense of Long Range Forecasts“, “What Is A Probabilistic Climate Forecast“, and “Seasonal Forecasts – Who To Believe?“, and “An Introduction to Long-Range Forecasting.“
A discussion of probability forecasts for the UK gas market is discussed relative to the UK composite weather variable.
In summary, the World Climate Service is actively deploying exciting new applications of long-range forecast data, with demonstrable skill and critical probability information. UK offshore wind is a key focus at the present time, but WCS technology is equally applicable to onshore wind farms, solar power generation facilities, and many other climate-sensitive industries. Contact us for a trial today!