In talking about the quality of weather forecasts, it is common to hear the words “reliable” or “unreliable” used in common parlance as well as in specialized and technical settings. It’s therefore worth considering what the notion of “reliability” means to different people, and how we use this notion in connection with subseasonal and seasonal forecasts.
In the most simple terms, the idea of “reliability” conveys information about whether the user can rely on the forecast in the sense of using it to make decisions. A reliable forecast would be one that doesn’t let you down, so that when you act on the forecast, it’s rare to regret the decision. A simple example might be the decision whether or not to take an umbrella for an afternoon trip; if the forecast shows a low chance of rain, then it’s a reliable forecast if rain rarely occurs on such days.
This everyday example illustrates that forecast reliability is connected to the probability framework for communicating forecast information. (Most short-range forecasts are not probabilistic, but some are – like the chance of rain.) In a world of uncertainty, we all know that forecasts ought to convey a range of possible outcomes, and we also have some intuitive understanding that the predicted range, or the predicted probability, should correspond to the outcome “most of the time”. Few people will be seriously concerned if they get caught out on a rare occasion by a rogue shower when the chance of rain is low. But if this happens often when the forecast points to a low probability, then the forecast provider will quickly be distrusted.
It’s not much of a leap, then, to recognize that “reliability” measures the degree of correspondence between the forecast probability and the observed frequency for an event or outcome that is being predicted. For a perfectly reliable forecast, the two are equal when measured over a long enough period to even out the statistics.
Examples of Forecast Reliability
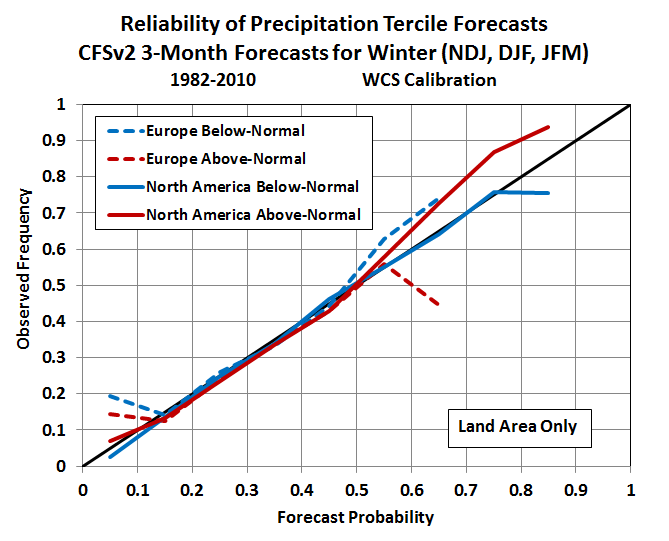
Here’s an example of a diagram that displays the forecast reliability information for seasonal forecasts of winter temperature over Europe and North America. The forecasts are taken from the U.S. CFSv2 model’s hindcasts for 1982-2010.
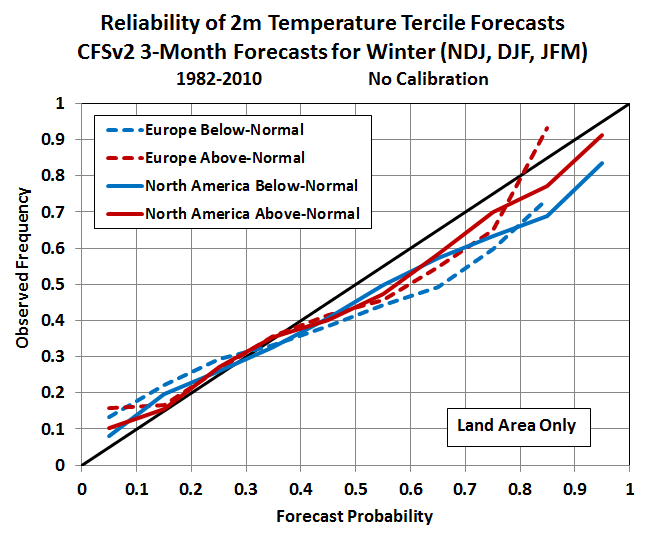
In this case we see that the red and blue lines do not follow the diagonal particularly well, and this means the forecasts are not entirely reliable. In fact, they’re over-confident; for example, when the probability is around 0.6-0.7 (i.e. 60-70%), the predicted outcome tends to occur only about 50-60% of the time.
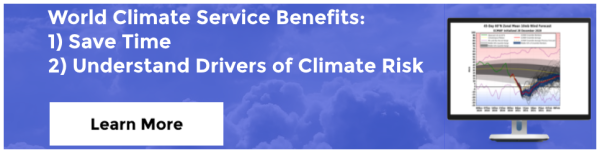
Now consider the same forecasts after they’ve been improved by World Climate Service calibration, which adjusts the probabilities to be more reliable.
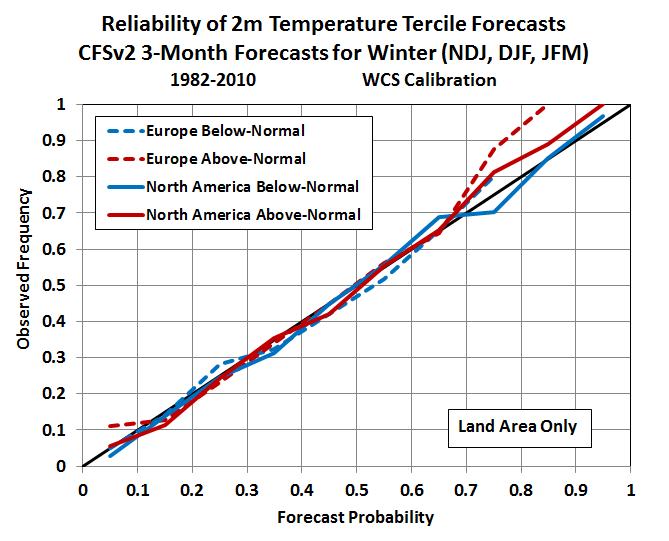
We can do the same thing for precipitation, and in this case the calibration is a more pressing issue, because the “raw” CFSv2 forecasts are severely over-confident. What this means is that anyone using uncalibrated precipitation data from the CFSv2 model is likely to be disappointed, and decisions made from the uncalibrated CFSv2 forecasts are likely to end badly.
How about another illustration of poor forecast reliability in long-range forecasts? This example is taken from a game developed by the HEPEX group to illustrate the application of seasonal forecasts to a real-world problem (summer water management). In the game, the player reacts to probability forecasts of water reservoir levels, and some of the forecasts have better “reliability” than others. According to the game instructions, the forecast reliability measures how often the outcome falls within the forecast range – a somewhat different definition from the one stated above, but qualitatively similar. Here’s a snippet from the instructions:
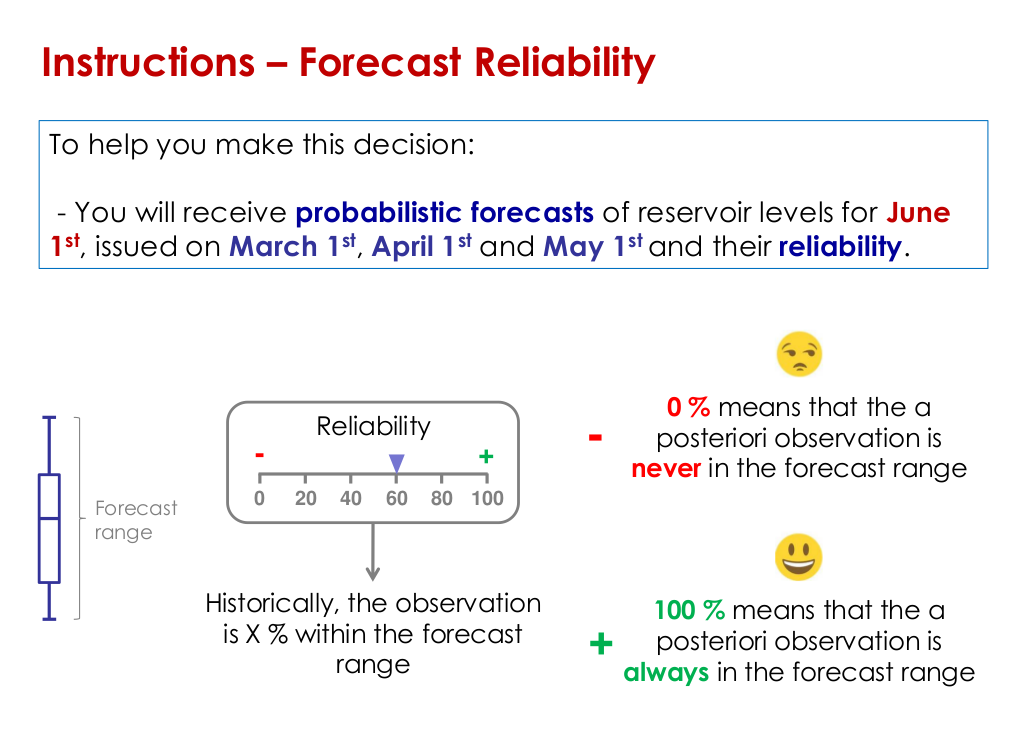
After playing the game, it becomes clear that poor forecast reliability seriously hampers the decision process, because the outcome too often falls outside the predicted range. In other words, the forecast probability does not correspond to the range of outcomes when the reliability is poor. Try the game for yourself – it’s instructive and entertaining, and it illustrates the importance of forecast reliability.
NOAA Hurricane Outlook Forecast: Another Example
We published another example examining the reliability of the NOAA Hurricane Outlook. It’s a great example of demonstrating the reliability of a widely consumed probabilistic forecast.
Conclusion
In summary, the notion of forecast reliability is actually quite simple; it’s just a fundamental measure of the quality of a probability forecast. In other words, do the probabilities mean what they say? Does the probability misconstrue the actual risk, or is it “true” to the actual risk? At the World Climate Service, we argue that probability forecasts simply must be reliable if they’re going to be used for decision making; if they’re not reliable, then as the saying goes, “all bets are off”.
So the next time you see a probability forecast, ask yourself, is this a reliable probability? How do you know? Has the forecast provider done the work to calibrate the probability? The World Climate Service subseasonal and seasonal probability forecasts have been developed over more than a decade and are always calibrated and therefore reliable and useful for critical real-world decisions. Request a trial today!