North Pacific Warm SSTs
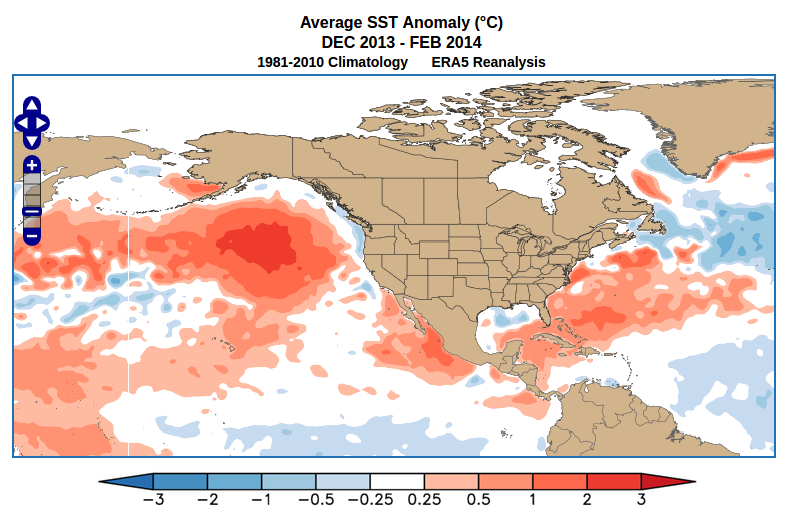
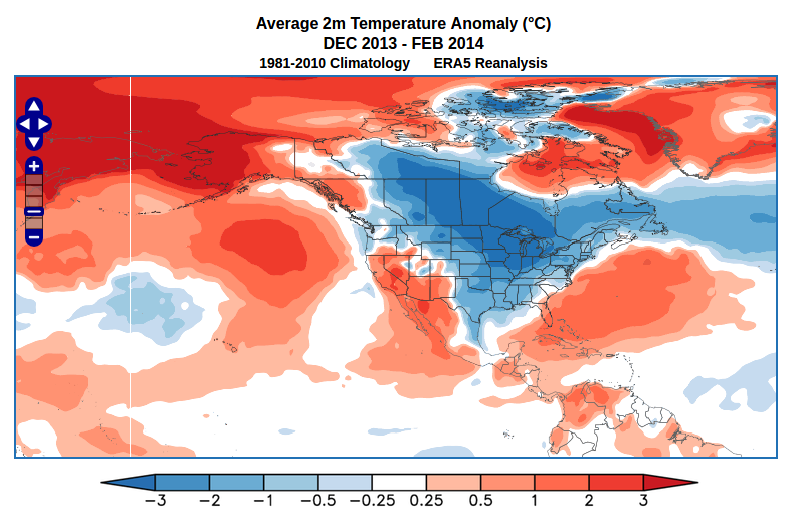
One of the most striking and persistent climate anomalies of recent years has been the widespread unusual warmth that has affected the North Pacific Ocean. Beginning in summer 2013, sea surface temperatures (SSTs) became much warmer than normal between Alaska and Hawaii, and as the warm anomaly persisted and intensified over the next two years, it gained widespread attention and became known in some circles as the “The Blob“. The large region of elevated ocean temperatures produced major impacts on ecosystems around the northeastern Pacific, and the anomaly was also implicated in the “polar vortex” winter of 2013-14, which brought very cold conditions to central North America (see below).
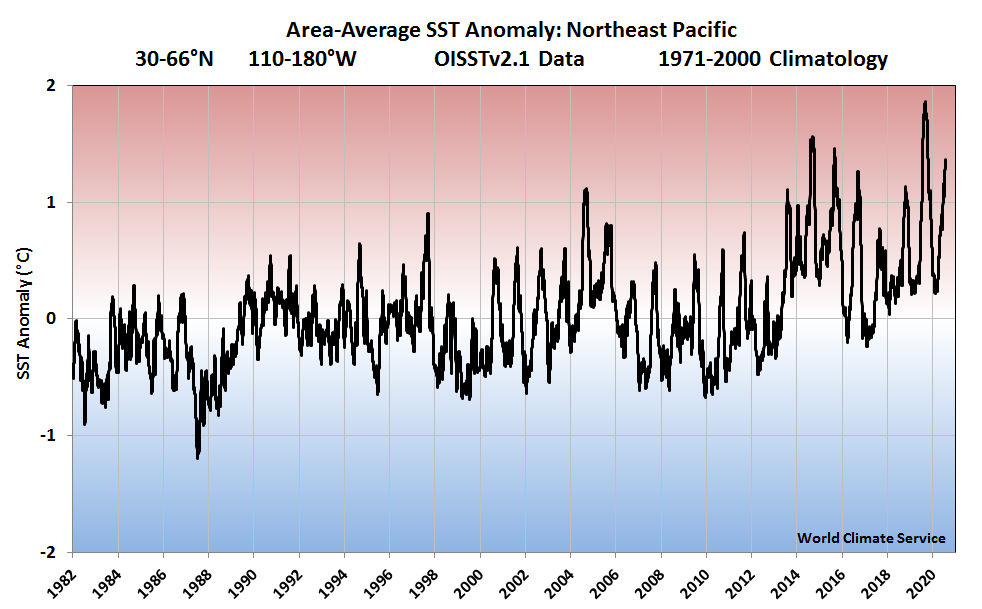
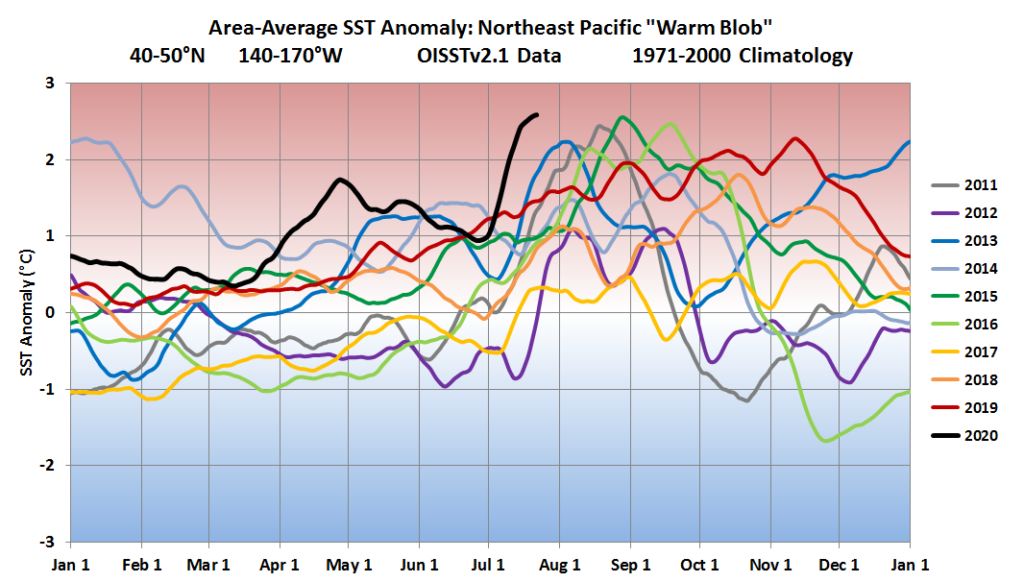
In the years since the 2013 emergence of the warm anomaly, the World Climate Service has closely tracked North Pacific SST patterns, and WCS seasonal forecasts for North America often rely on the known effects of prevailing and expected North Pacific anomalies. The chart below shows that the northeast Pacific’s unusual warmth of 2013-2015 was partly eliminated by the strong El Niño of winter 2015-16, but widespread extratropical warmth returned more strongly than ever in 2019, and strong warming has again occurred in recent months.
North Pacific Annual Cycle
Interestingly, northeast Pacific warmth has been especially unusual in late summer, and a pronounced annual cycle has developed in the area-average SST anomalies; this is clearly visible in the chart above. The figure below illustrates the cycle more clearly, with SST anomalies showing a strong tendency to increase during early-mid summer, peak in August and September, and then decrease in autumn. Remarkably, every year since 2013 has seen considerably above-normal August-September SSTs, at least relative to the 1971-2000 baseline that’s used in the OISSTv2.1 dataset.
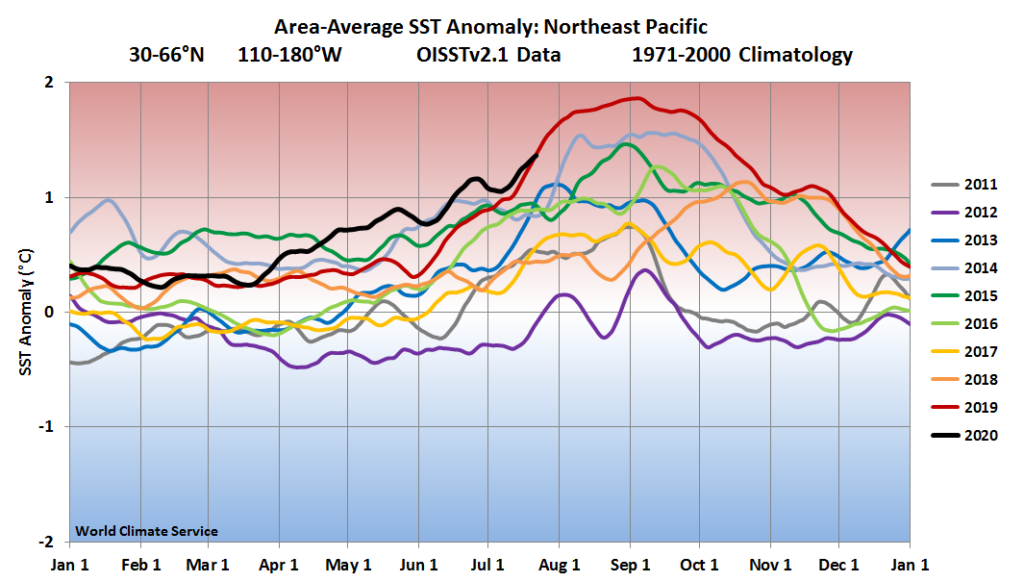
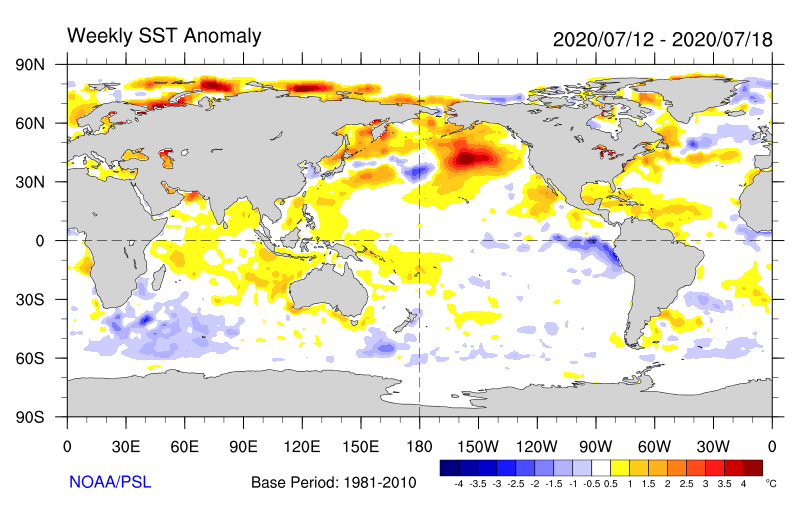
If we zoom in on the smaller region of the northeastern Pacific that is particularly associated with the “Blob” pattern (i.e. Hartmann’s North Pacific Mode), we find that this summer’s warm anomaly has already exceeded anything that was observed in the past 10 years – see below. Based on a 14-day running average, we’re currently looking at the highest SST anomaly in this particular region since the late 1981 start of the OISSTv2.1 data.
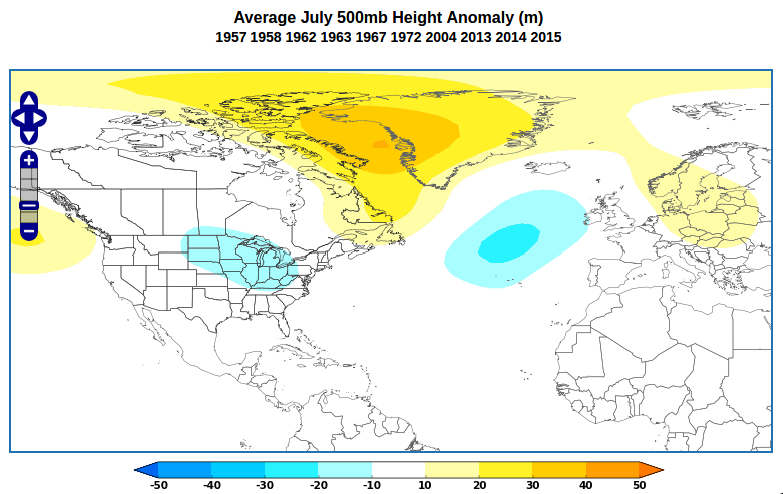
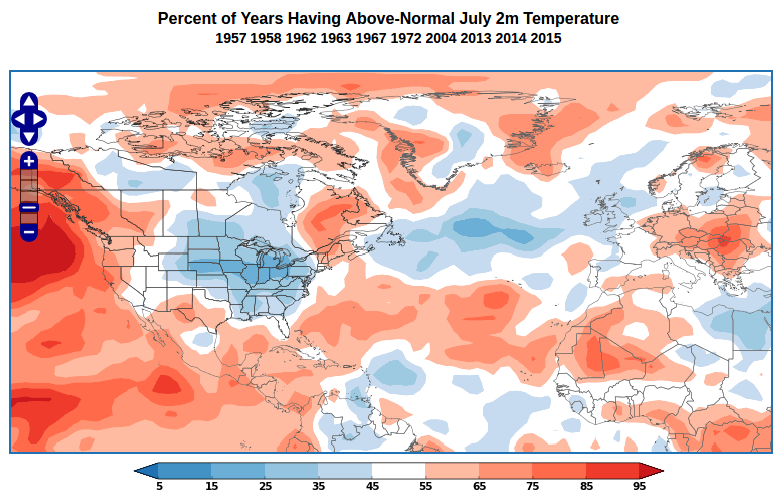
What are the implications of the North Pacific warmth for weather and climate elsewhere? Time does not permit a full exploration here, but it’s worth noting that highly unusual warmth in the “Blob” region at this time of year is quite closely associated with high pressure in the Arctic (a negative phase of the Arctic Oscillation) and a trough over central North America. As a consequence, the central U.S. tends to be cooler and wetter than normal, and western Europe also tends to be cool. The maps below, created using the World Climate Service seasonal analog tool, illustrate these tendencies.
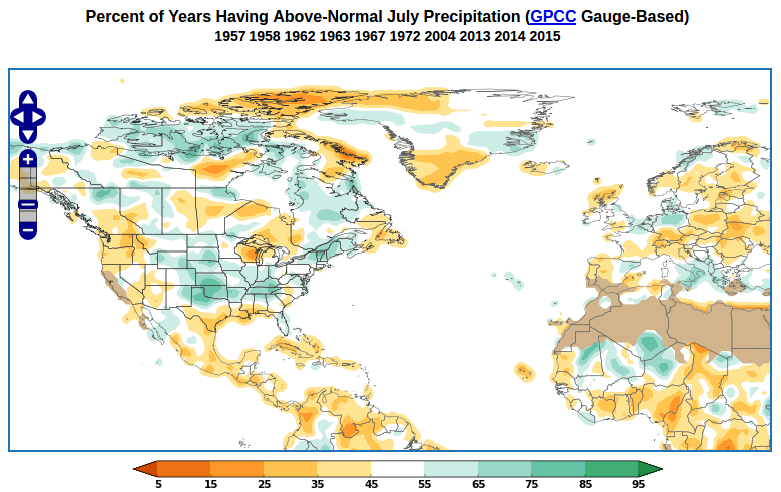
The central U.S. has not been particularly cool this month, but there’s no question that it has turned out much cooler and wetter than many expected at the beginning of the month, as the developing La Niña seemed poised to create serious heat and drought just a few weeks ago. While the sudden reprieve from heat was a surprise to many, World Climate Service customers were well-prepared for a potentially cooler and wetter outcome, as the emerging North Pacific warmth was identified as a major factor in the summer pattern from as early as March. In particular, the WCS summer forecast listed the expected North Pacific anomaly as a key driver of the North American summer pattern, with potentially more significance than the uncertain trajectory of the emerging weak La Niña.
Sign up for a WCS trial today and reap the benefits of insights like these in our seasonal forecast reports, along with comprehensive website tools for developing your own climate analysis.