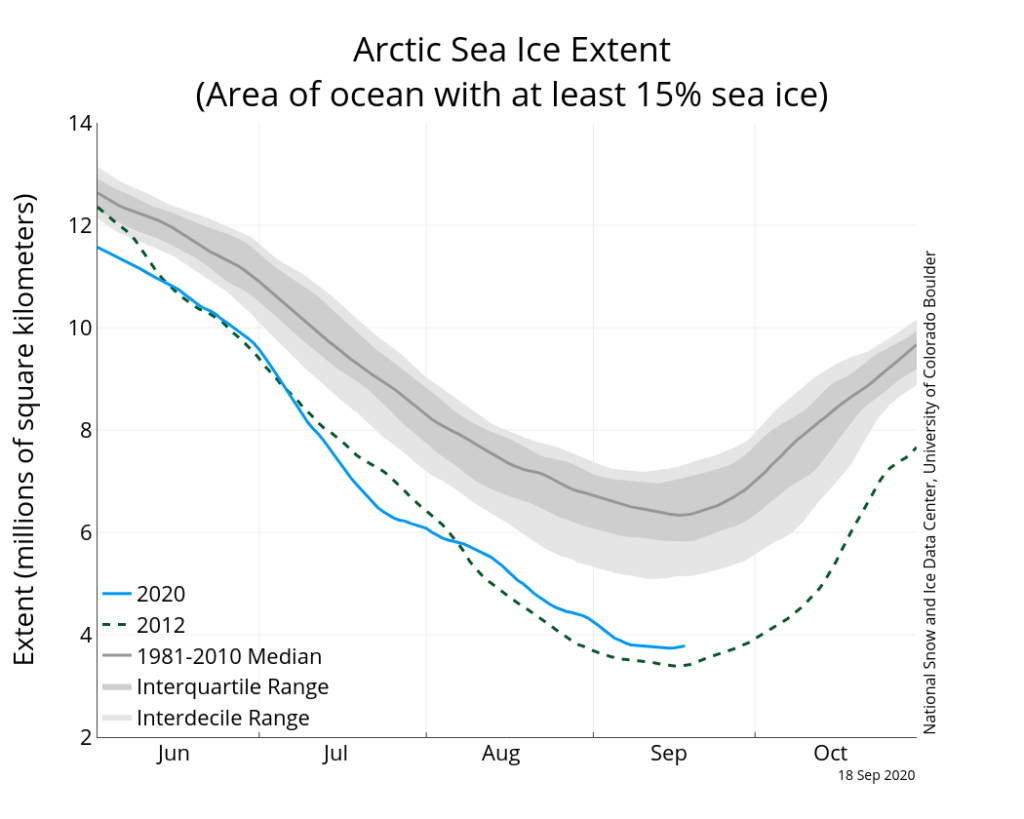
Arctic sea ice has reached its seasonal minimum, and after a summer of exceptional warmth near the Russian coast, this year’s minimum ice extent is the second lowest on record. For only the second time in modern history, Arctic sea ice extent dropped below 4 million km2, but 2012 still holds the record for most open water in the Arctic Ocean. See here for today’s NSIDC announcement of the annual minimum: http://nsidc.org/arcticseaicenews/2020/09/arctic-sea-ice-decline-stalls-out-at-second-lowest-minimum/
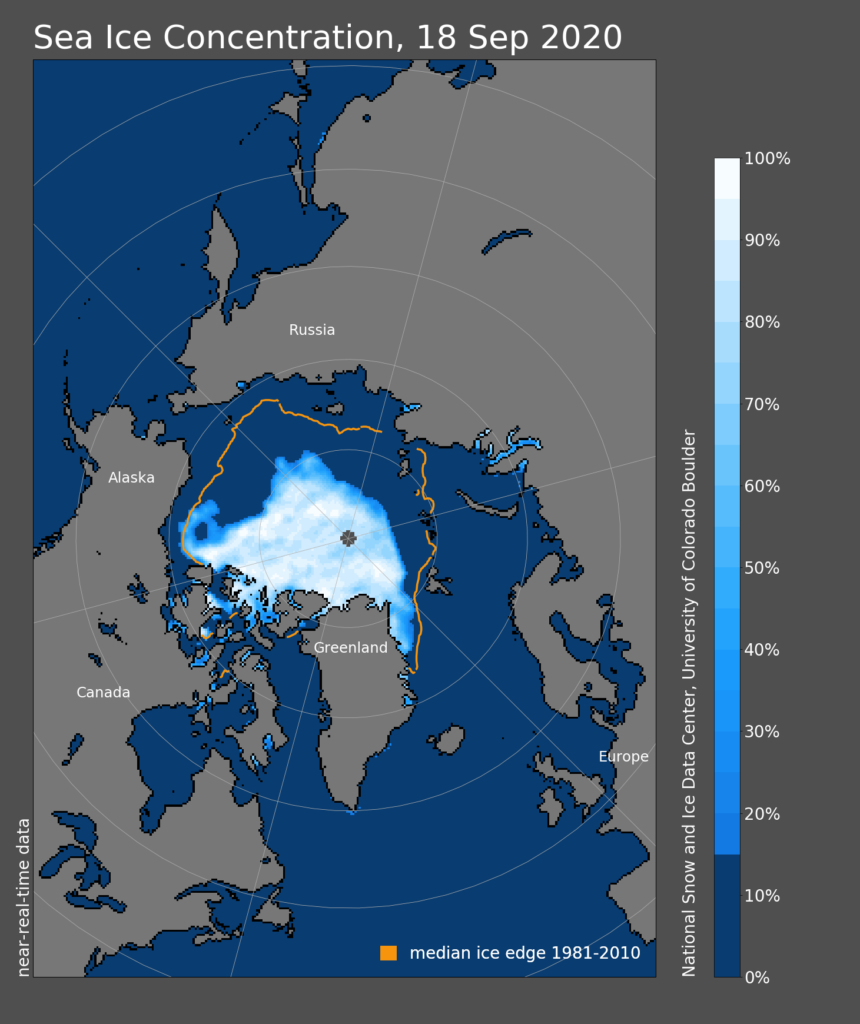
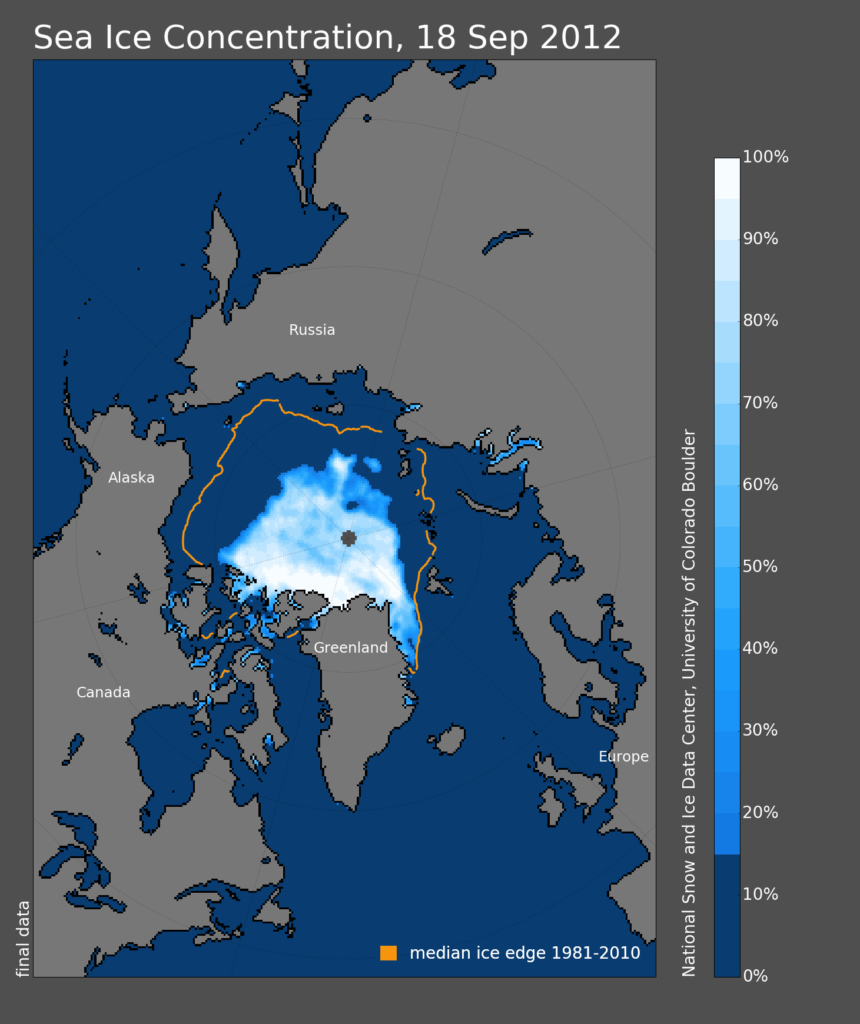
Comparing the ice concentration images from 2012 and 2020, the situation is quite similar, although more ice remains in the Beaufort Sea this year, and there’s a larger area of reasonably high ice concentration in the central Arctic Ocean. However, melt-out has advanced closer to the pole on the Russian side than in 2012; there is wide open water north of 85°N at 60°E, i.e. only about 300 miles from the pole.
Arctic Sea Ice and Summer Climate
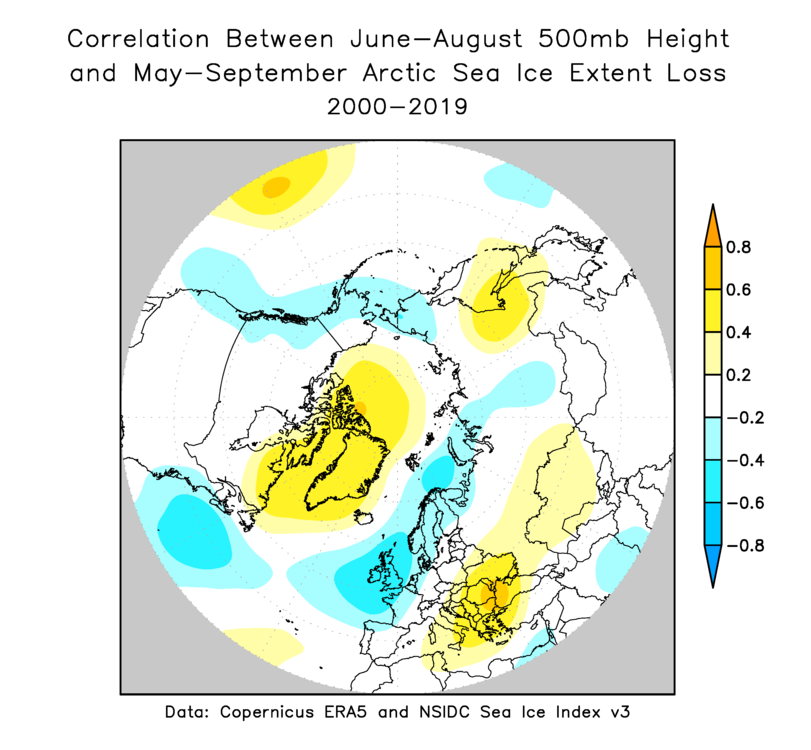
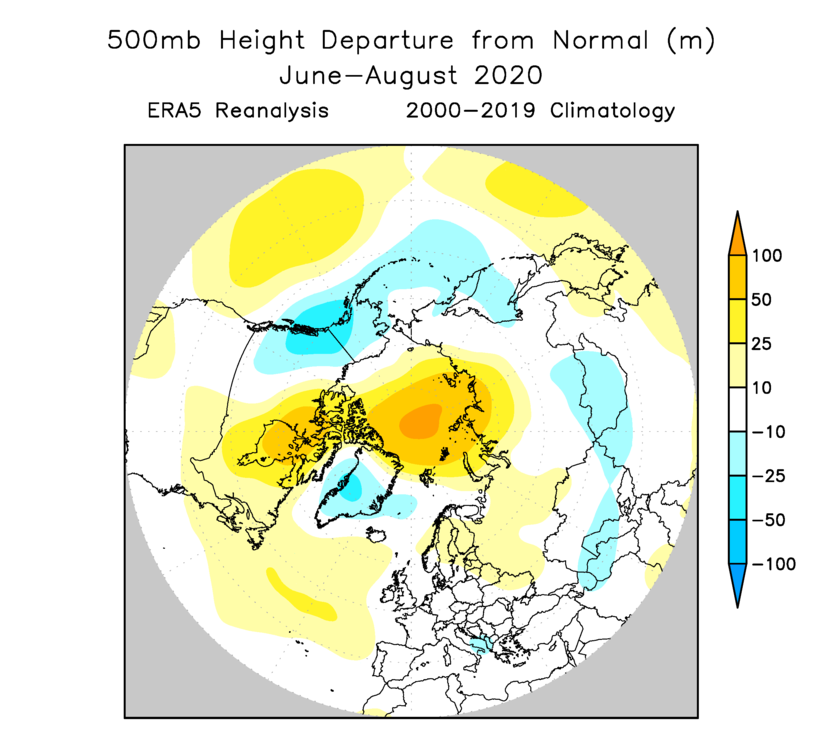
It’s interesting to consider how summer weather patterns affect the magnitude of ice loss. Using the annual difference in ice extent between May and September to measure summer ice loss, the map below shows the correlation with June-August mean 500mb height over the last 20 years. This reveals quite clearly that a negative phase of the Arctic Oscillation, involving higher heights (pressure) over Greenland and the high Arctic, is a pattern that favors more ice loss than the inverse (positive) AO phase.
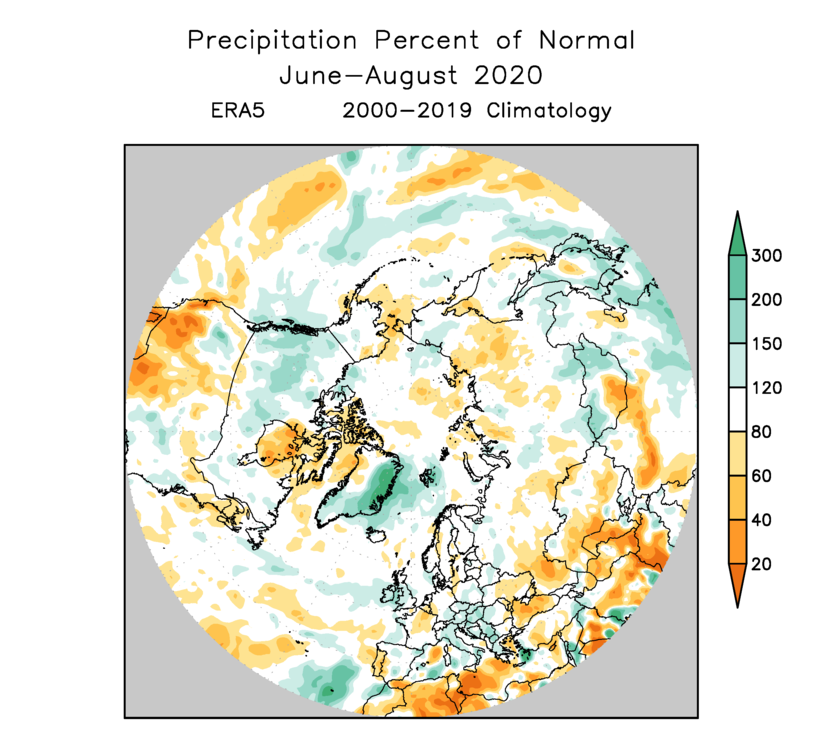
A negative AO also brings low pressure to northwestern Europe, and so it turns out that a wet summer in the British Isles is significantly associated with greater ice loss. Here’s the correlation map for precipitation.
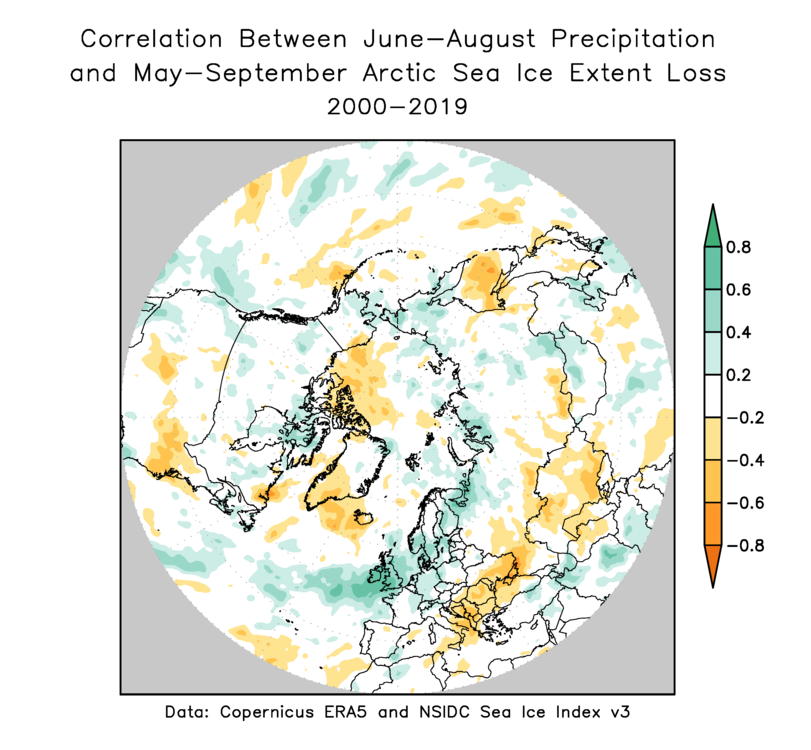
Did this summer fit the pattern for enhanced ice loss? In a very broad sense yes, as there was a very notable ridge over the Arctic Ocean, but it wasn’t aligned with the typical Greenland epicenter of the Arctic Oscillation, and the AO index was only slightly negative. However, the trough over southern Alaska was quite characteristic of low ice years, and it was indeed quite a wet summer in parts of the British Isles – see below.
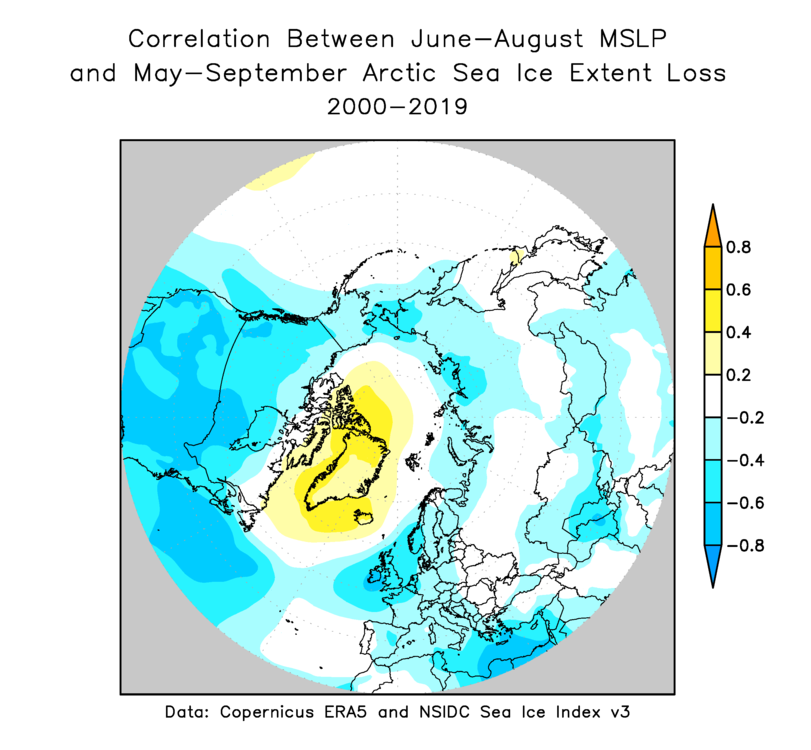
Below are the correlation maps and the corresponding 2020 anomaly for a few other variables. Note that we’re using ERA5 data to capture the historical climate anomalies; World Climate Service users can view ERA5 anomaly maps on our seasonal climate portal.
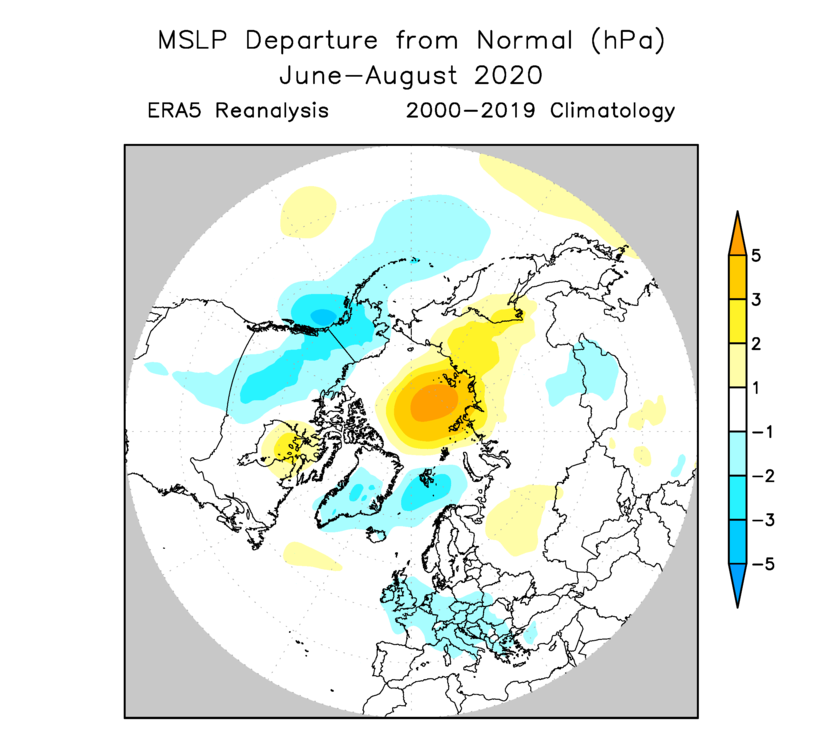
Mean sea level pressure shows the Arctic Oscillation pattern very clearly, with a ring of low pressure around the Arctic margins surrounding the Greenland high pressure anomaly in a typical low-ice year. The rather strong inverse correlation with MSLP over most of North America is interesting and unexpected.
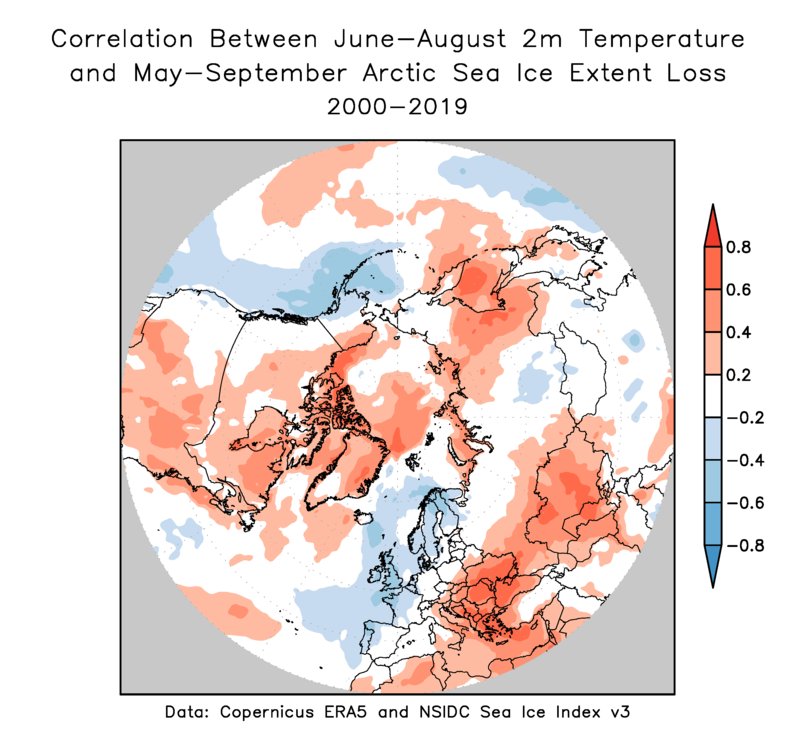
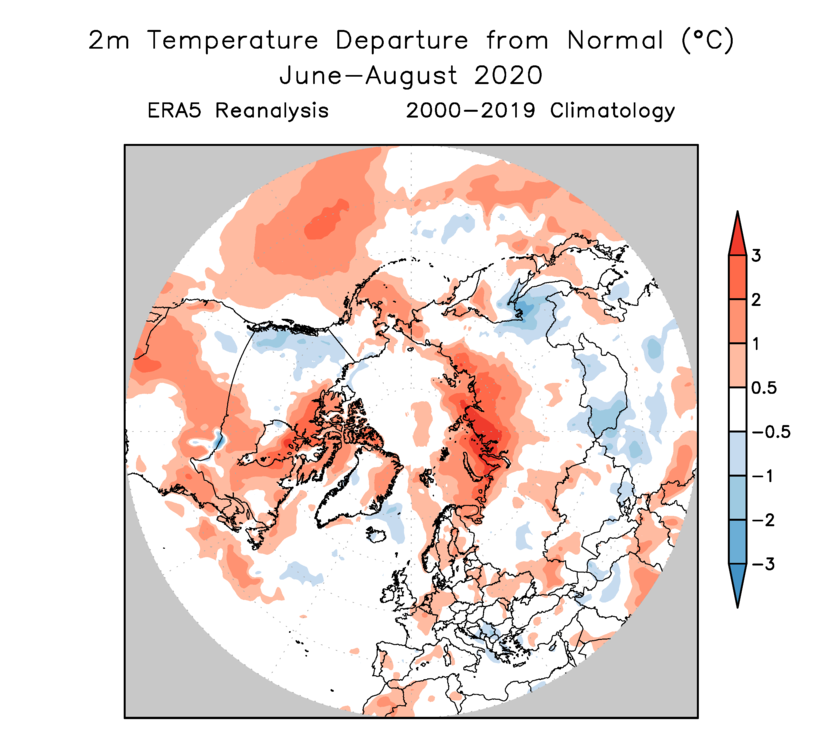
For temperature, eastern North America and of course most of the Arctic tend to be warmer when ice loss is large, but southern Alaska and western and northern Europe more often have a cool summer in these years. This year didn’t match these patterns particularly well, although July was exceptionally cool in northern Europe.
Finally, and perhaps surprisingly, solar radiation tends to be lower than normal across most of the Arctic except the Beaufort Sea in low sea ice years – at least based on these ERA5 estimates for the last 20 years – and 2020 certainly fit the bill in this regard.
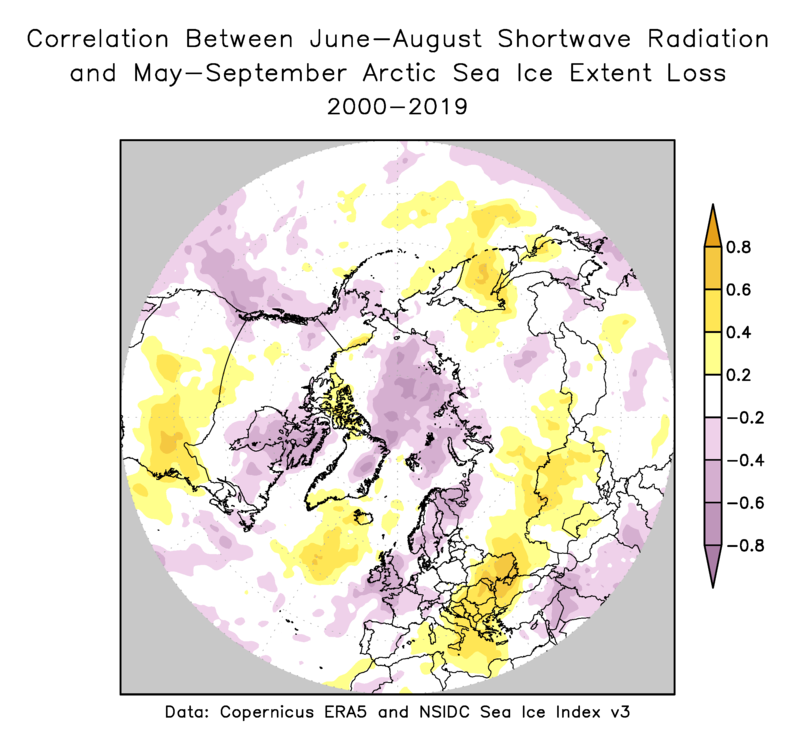
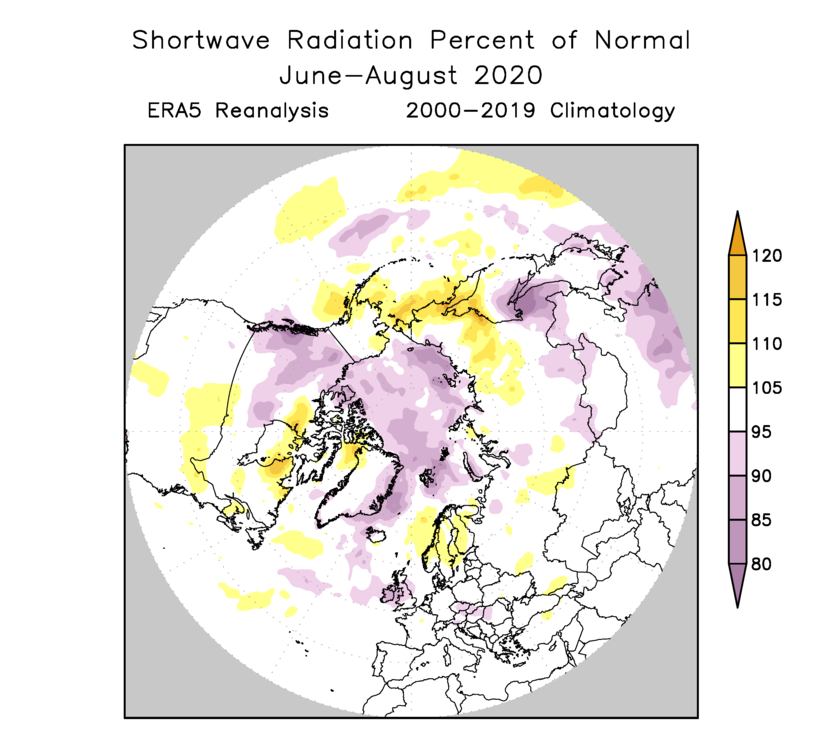
If this is correct, it strongly suggests that clear skies and increased sunshine are not responsible when summer melt-out is large. Rather, it seems that increased cloudiness would provide greater surface warming via increased downward longwave radiation, and this effect appears to be particularly important in the Eastern Hemisphere, where sea ice is more vulnerable with less thick multi-year ice. The result also suggests that the ice albedo feedback may not be a significant factor in high melt years, although it would be good to hear from Arctic climate experts on whether that conclusion is justifiable.
One final comment to make is that causation goes both ways when it comes to the typical weather patterns accompanying higher or lower sea ice loss. Obviously, surface water temperatures can rise well above freezing once ice is gone, and near-surface air temperatures are no longer held down to the same extent. Similarly, evaporation is much higher over open water than over ice, and this could explain greater cloud cover in low ice years. So while this discussion was introduced as “how summer weather patterns affect the magnitude of ice loss”, it’s undoubtedly true that the weather in turn responds to the ice situation – and not just on seasonal time scales, but also in terms of longer-term trends.