What is the Composite Weather Variable?
The composite weather variable (CWV) is an optimized combination of temperature, wind speed, and solar irradiation to linearly predict natural gas demand in 13 United Kingdom local distribution zones (LDZs). The CWV is created via a linear regression for each LDZ of gas demand versus daily temperatures, wind speed, and solar irradiation. The composite weather variable is used by gas production, supply, and trading organizations to manage weather risk and create trading opportunities.
XOServe, the company that manages the CWV formulations for the UK gas industry, says the CWV is:
” is a single measure of daily weather in each LDZ and is a function of actual temperature, wind speed, solar radiation, effective temperature, Seasonal Normal Effective Temperature(SNET), and Seasonal Normal Effective Solar (SNES). The definition of CWV includes provision for summer cut-offs and cold weather upturn during low-temperature extremes, defined such that a linear relationship applies between daily demand in the LDZ and the CWV.”
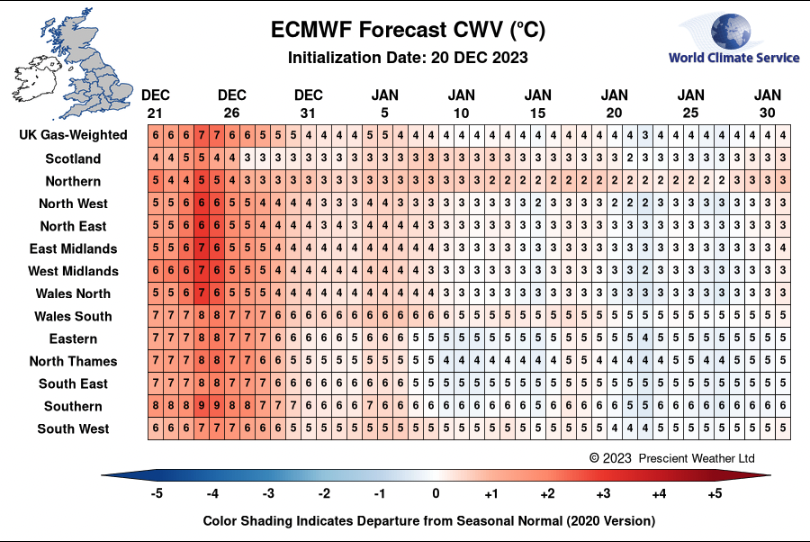
As a result, weather conditions and forecasts are a critical concern in the UK energy industry, which relies on highly accurate forecasts to prepare for future demand and anticipate market price fluctuations. Since 2018, the World Climate Service has produced forecasts of the UK’s Composite Weather Variable (CWV), and several major UK gas industry participants now rely on this World Climate Service product. An example LDZ composite weather variable forecast is shown below.

CWV Forecasts Benefits
Gas traders and merchants in the United Kingdom who provide gas to end users use World Climate Service forecasts of the CWV. The forecasts are used to ensure the best possible price for gas given changes in the weather, which impacts gas demand and therefore prices.
Ben Armstrong, the Head of Gas at Jellyfish Energy and a user of WCS CWV forecasts, says “The WCS forecasts have been incredibly accurate, helping me forecast within day & day-ahead gas demand in our customer base with a less than 0.5% mean absolute percentage error (MAPE). This accuracy has improved our bottom line and given improved the flexibility of our capital allocation. This accuracy has allowed us to hedge and adjust prompt positions with confidence, as well as dramatically reducing our exposure to National Grid’s End of Day System Balancing.”
Daily Updates for UK Gas Demand
World Climate Service CWV forecasts are updated daily for the next 14 days, and we also deliver sub-seasonal CWV forecasts based on both the CFSv2 and ECMWF weather forecast updates. Forecasts are made for 13 Local Distribution Zone (LDZ) areas and for a demand-weighted national index. Data is delivered via API, secure FTP, and email methods, and the World Climate Service graphical interface provides visual access to the forecasts.
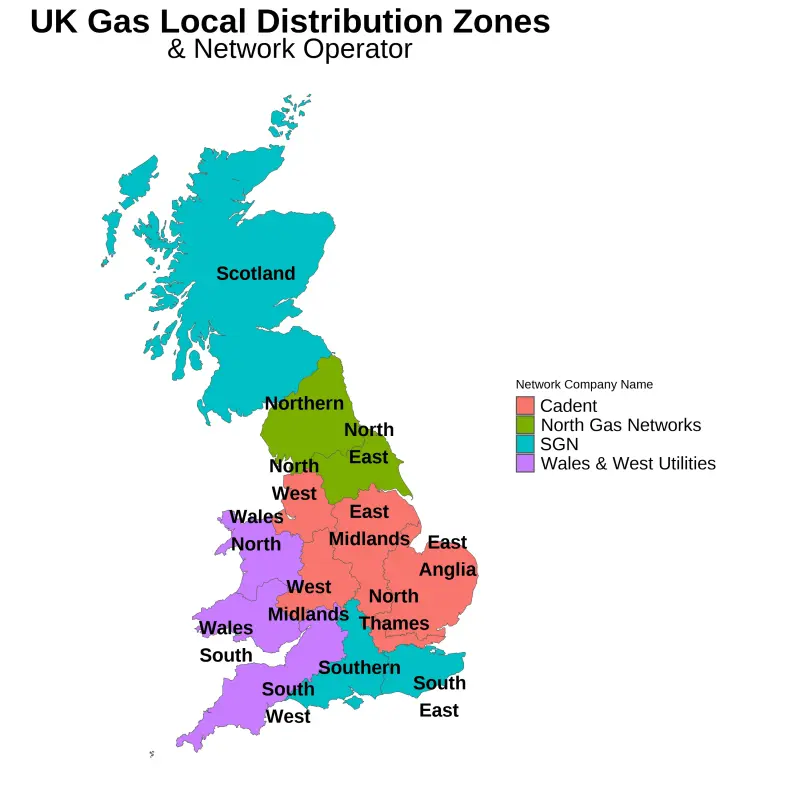
UK Gas Local Distribution Zones (LDZ)
There are 13 UK gas local distribution zones (LDZ) as shown in the map below. Gas delivery in each LDZ is managed by a gas network company, which is also indicated in the map.
The local distribution zones determine who supplies natural gas to residences and businesses with in each LDZ. In addition to the gas network companies, companies such as Jellyfish Energy manage customer gas accounts.
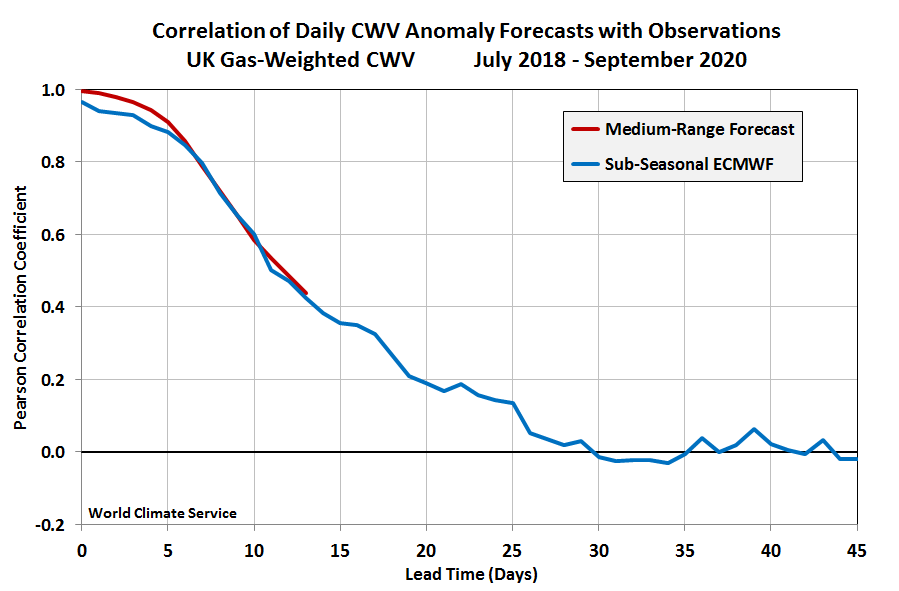
CWV Forecast Performance
The figures below summarize the performance of the CWV forecasts since July 2018. First, the correlation of the daily forecasts with observed values drops below 0.6 at a lead time of 10 days; beyond this, the forecasts explain less than a third of the daily variance, although there is some skill on a daily basis all the way out to nearly 30 days in the future. The red curve shows the performance of the daily-updated medium-range forecast, and the blue line pertains to the bi-weekly extended ECMWF forecast out to 45 days.
The second chart – see below – shows the performance of probability forecasts for weekly-average CWV values. The World Climate Service emphasizes probability information because of its great value for decision-making (e.g. see the previous discussion here), and therefore the probability format is a critical component of the CWV product. Performance is measured here by “fraction correct”, which indicates the fraction of the time that the probability forecast is on the right side of normal; in other words, if the probability is 51% that the weekly-average CWV will be above normal, then this is “correct” if the CWV does turn out to be above normal.
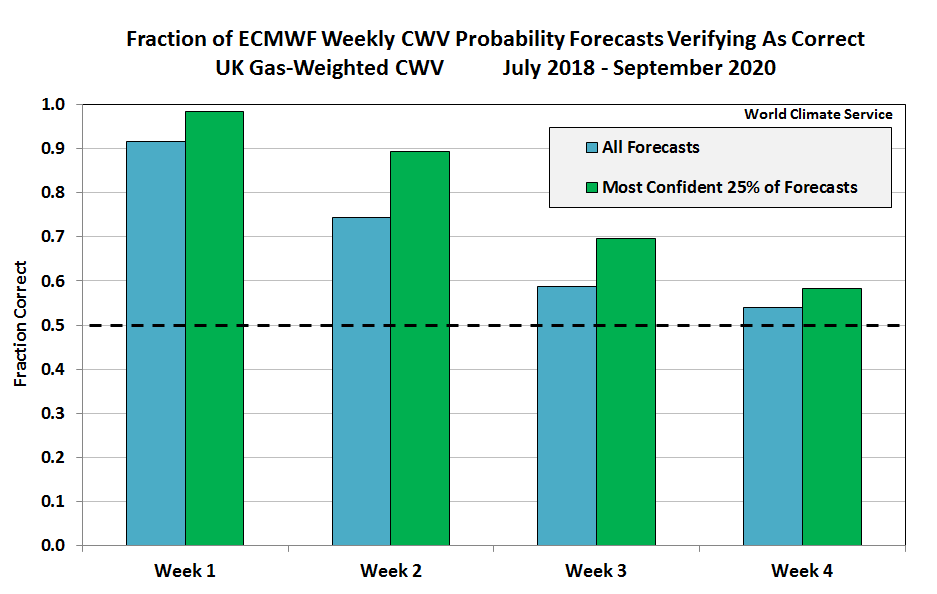
The blue columns in this chart show results for all of the bi-weekly probability forecasts issued since July 2018, and the fraction correct declines from about 91% in the first week to about 59% in week 3; and by week 4 the forecasts are only marginally better than random chance.
However, better results are obtained for the subset of forecasts that have an enhanced probability signal: the green columns show the skill for the 25% of forecasts with the greatest confidence (highest probability) at each lead time. Week 3 shows a particularly significant improvement – higher confidence boosts the fraction correct from 59% to 70%, which more than doubles the excess over random chance.
Use Probability Forecasts For Success
The probability performance results shown above demonstrate that World Climate Service forecasts provide significant and valuable skill beyond the traditional two-week barrier for deterministic predictability. Users of the CWV probability forecasts, for example, were able to anticipate departures from normal in week 3 with a 70% success rate when using only the forecasts that showed a relatively high degree of confidence (as opposed to the more common low-confidence forecasts). For another example of good performance in probability forecasts, see this recent discussion regarding the use of probability forecasts for UK offshore wind farms.
Upgraded UK Gas Demand Index
As of October 1, 2020, the UK’s Composite Weather Variable was upgraded to a new version that includes a better representation of weather impacts in each part of the nation’s gas transmission network. With a refined CWV index and continued improvement in long-lead weather forecasts, the World Climate Service CWV product is more valuable than ever for gas distribution companies, gas retailers, and other market participants. Sign up for a trial of the CWV service today!
Request your CWV Forecast Trial Today
Email us at info@worldclimateservice.com to request your risk-free CWV forecast trial today.