A guest post authored by James Richards, FRMetS of Meteoric Weather.
Introduction
I qualified as a UK Met Office forecaster back in 1995. Even in those days, forecasters were encouraged to frame forecasts in terms of probabilities. And with good reason. Ahead of time, the future has a range of possibilities, and with our forecasting skill, we can drastically narrow down the range of uncertainty, thus providing valuable information to any interested party.
Fast forward a quarter of a century, and in everyday weather forecasts, probabilities remain conspicuous by their absence. It’s true we often see them used as a risk of rain indicator, but probabilities certainly haven’t become mainstream in the way that it was hoped. It turns out there’s a good reason for that.
People like Their Weather Forecasts in Black and White
It is human nature to think in terms of black and white; right and wrong; it’s either raining or it’s not. Thinking in this way is clear and comfortable; it makes sense. We like our forecasts to be definitive: will there be a frost or not? We need the decision to be made for us; when we receive a forecast, we do not want the additional effort and responsibility of having to figure out what the message really is. We simply do not like to be given ambiguous information, and probabilities seem ambiguous, no matter how valuable that information may be.
There’s no getting away from it; probabilities can be a little difficult to digest. Let’s take that rain forecast as an example. I know from experience (thanks mum), that if I tell someone there is a 50% chance of rain tomorrow, then they’re probably going to respond with “gosh, no kidding James, thanks for nothing”. The fact that on a late November day in London it only rains 25% of the time is lost on them. They don’t see that the risk is double what we could reasonably expect for the time of year. In fact, even to this day, UK Met Office forecasters are instructed to avoid forecasting a 50% chance of anything!
So where does that leave us? The fact is, forecasts need to be delivered in a format that is appropriate to their audience. Probabilities are extremely useful for those that are comfortable with them, and that group is no longer restricted to statisticians. In 2020 the majority of businesses are putting data to work, to improve efficiencies, and ultimately gain competitive advantage – and weather data has become a much valued commodity.
The Magic of Mathematics
If you are not using reliable probabilistic forecasts (RPFs), then you are missing out on a thing of beauty. As strange as it may seem, RPFs are NEVER wrong. Not only are they never wrong, but they can be applied on a long-range horizon, which means that even long-range forecasts are never wrong!
As a weather forecaster, I often admit that my forecasts are always wrong, it is just a question of how wrong. And whilst this is inevitably true in our deterministic, black and white world, the same cannot be said in the world of the RPF. In the world of the RPF, the probability is always correct – how can this be so?
Let’s explore the RPF with the help of long-range forecasting ideas. In long-range forecasts, the uncertainty is such that we usually need to average over whole weeks, and we break the range of possibilities down into 3 equally likely groups; below normal, near normal, and above normal.
Let’s say we have a forecasting system with a 30 year history. We can go back and count how often an event occurred for each time it was forecast with a given probability.
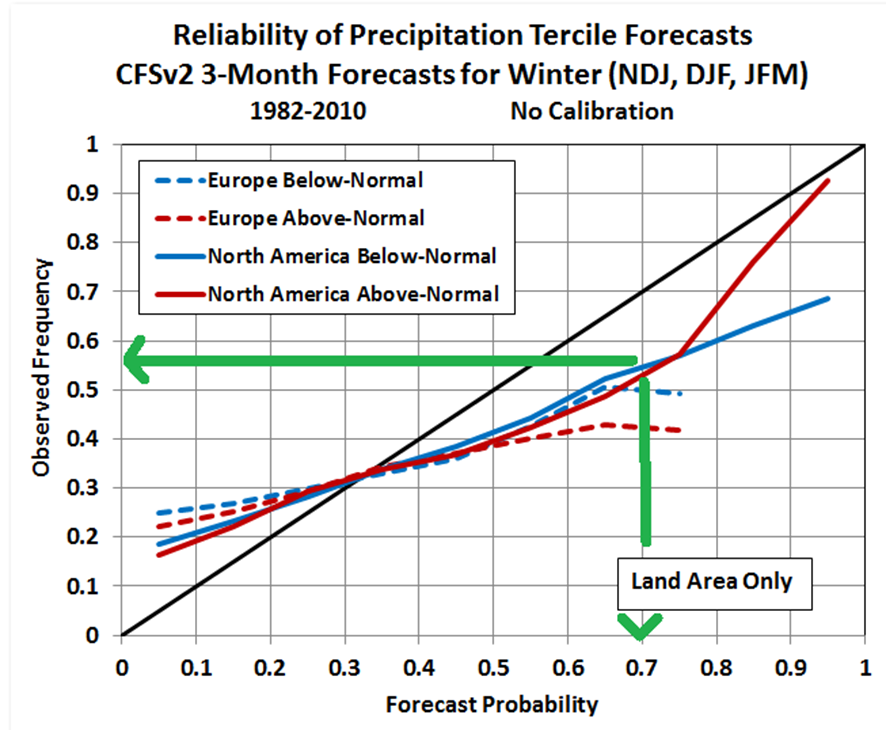
When we do that, we arrive at a reliability diagram like this (below). It shows that when North America winter rainfall below normal was forecasted to be a 70% risk, then it occurred 55% of the time, and similarly when North America winter rainfall below normal was forecasted to be a 20% risk it occurred 25% of the time. This system is not reliable, because an event with a risk of X% should happen X% of the time. However, with some statistical magic (calibration), we can adjust the historic forecasts (and therefore future forecasts) to ensure that they are always reliable.
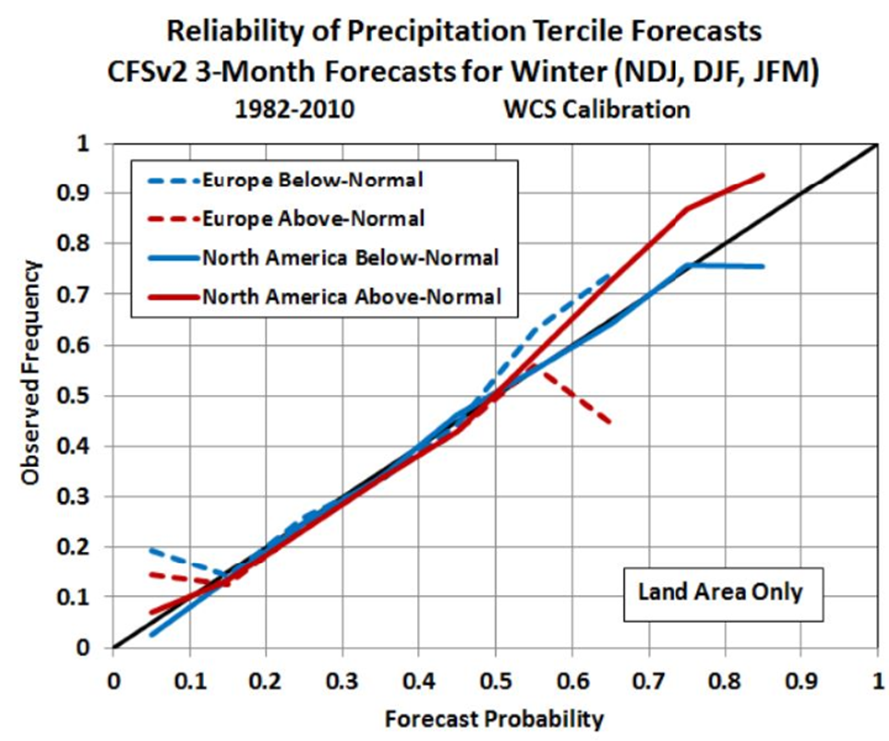
The diagram below shows the behaviour of the forecasts after calibration – the forecasts are almost perfectly reliable over a wide range of commonly occurring probabilities. This means that whenever we see a forecast rated X% likely, we can rest assured that on average it will happen in the real world X% of the time. The probability is ALWAYS correct.
How does this help? A business may wish to take action each time the forecast of an event, say, above normal wind speed 4-weeks ahead, reaches a certain threshold of likelihood. This can be done confident in the knowledge that the event WILL happen with the frequency chosen – no more, no less.
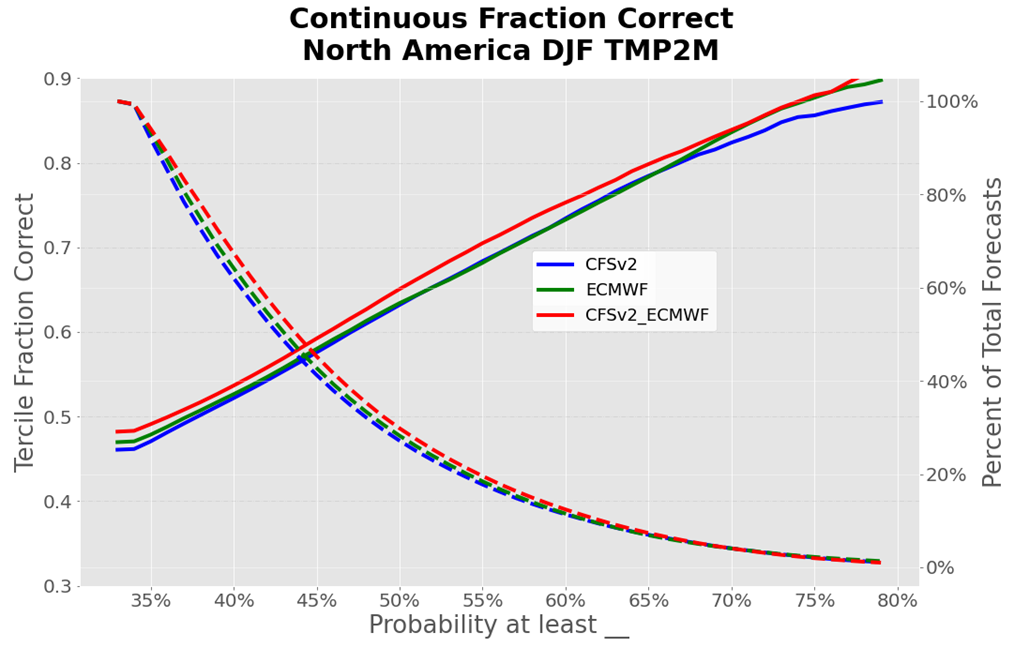
So what’s the catch? You might be thinking; that’s all well and good, but what if my business needs a high-confidence forecast to make a critical decision? Perhaps the forecast never shows a risk high enough to act on. The forecast history gives us the information to determine whether this is a problem; we can examine how often a particular threshold is reached. The graph below shows (right axis) that a 55% probability is forecasted on average once in every 5 forecasts (20%) in this particular example.
To sum up, the power of probabilities means that not only is the properly-calibrated probability forecast never wrong, but you can also choose to act confidently at a threshold (risk) defined by your business sensitivity. In this way you can optimise your response to the forecast, and automatically capture all of the value, each time the forecast reaches the level of confidence your business requires.