Summary: Historical analogs point to the likely impacts of a weak stratospheric polar vortex and an amplified MJO forecast
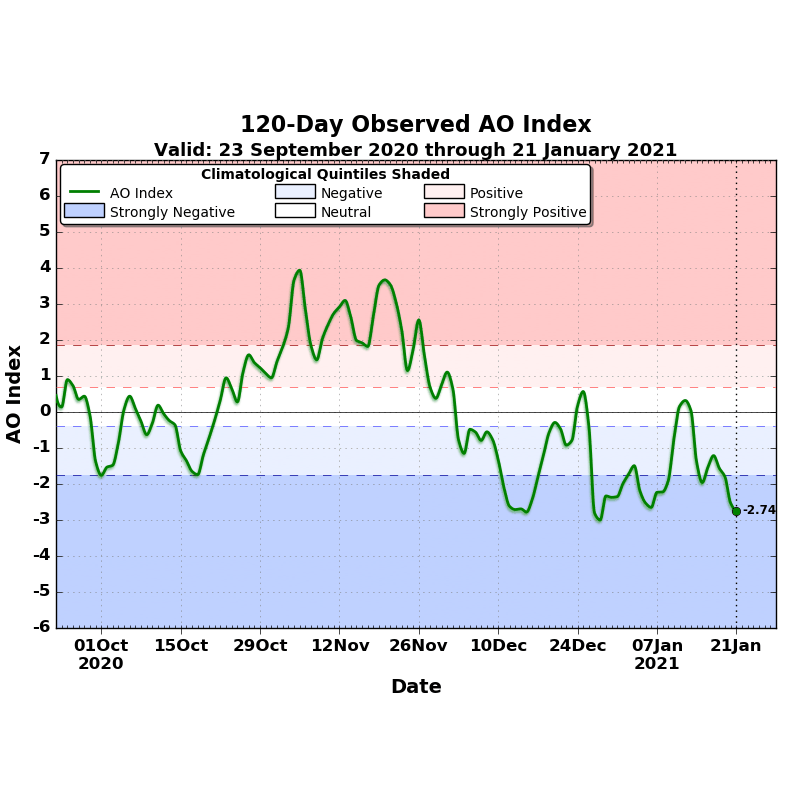
In a dramatic break with the pattern of recent years, this winter has seen strong and persistent high-latitude blocking that has produced unusual cold across most of Russia and East Asia. The Arctic Oscillation has been significantly negative since early December, and the North Atlantic Oscillation will be negative for both December and January for the first time in a decade. Figure 1 shows the AO index from the past few months; this figure – and all others in this post – are available to World Climate Service customers in our online portal.
Sudden Stratospheric Warming
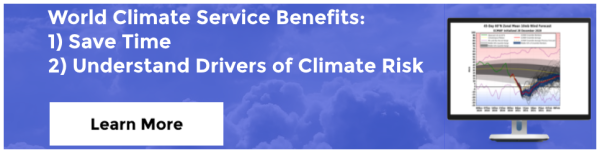
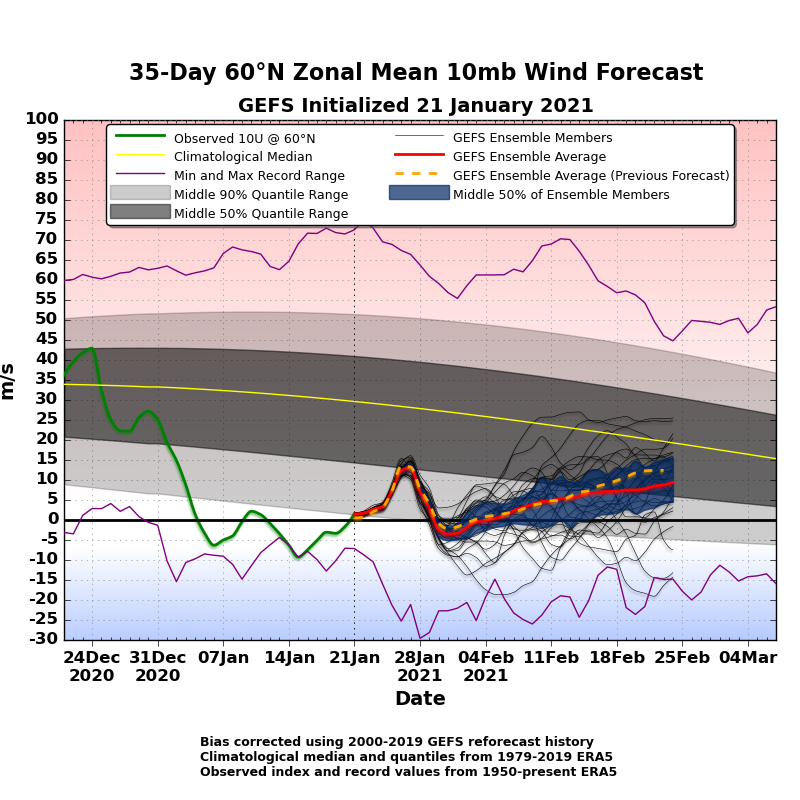
While the initial onset of a negative AO pattern in December occurred in conjunction with a relatively strong polar vortex in the stratosphere, a sudden weakening of the vortex around the turn of the year created a much more coherent Arctic anomaly, with strong vertical coupling between the troposphere and the stratosphere (figure 3). The 10mb westerly flow at 60°N reversed to an easterly direction on January 5 (Figure 2), marking the occurrence of a “sudden stratospheric warming” event.
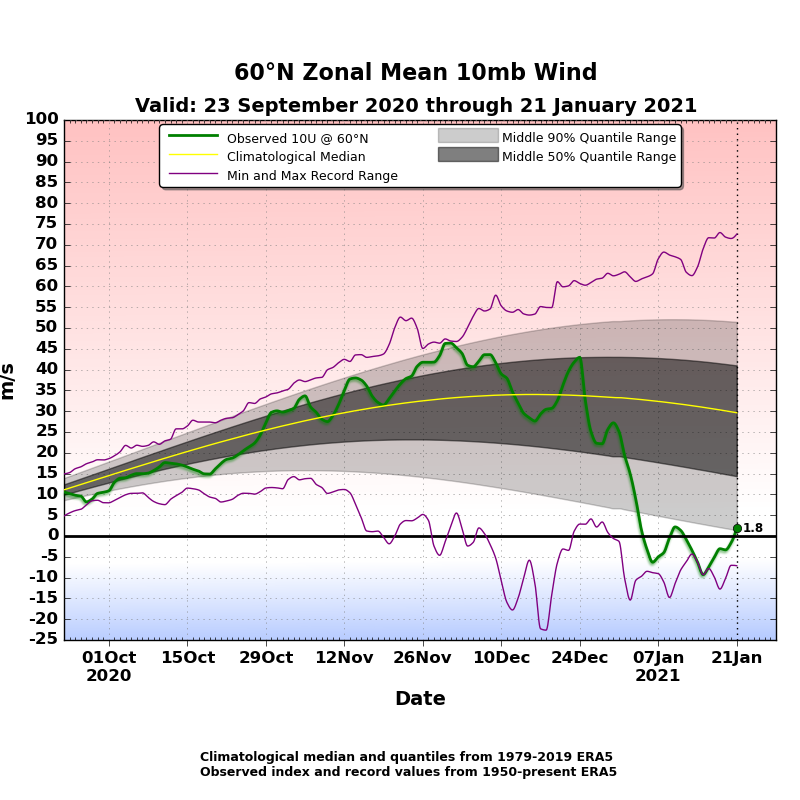
Remarkably, the stratosphere polar vortex has shown little recovery in the more than 2 weeks since the vortex disruption, and recent forecasts are showing another round of weakening – after a brief recovery – in the next two weeks.
MJO Forecast
The expected re-weakening of the stratospheric westerlies is linked to another major anomaly that models are expecting to emerge by early February: a very strong pulse of Madden-Julian oscillation (MJO) wave energy in the western Pacific. The MJO forecast shows the MJO index is predicted to move into phases 6 and 7 (figure 5), which are favorable for additional weakening of the polar vortex; this is because the transfer of wave energy from MJO 6/7 into the North Pacific lines up with the climatological stationary wave and enhances the upward energy flux that disrupts the westerly flow aloft. The relatively predictable evolution and well-known global impacts of the MJO provide a foundation for long-lead forecasts worldwide.
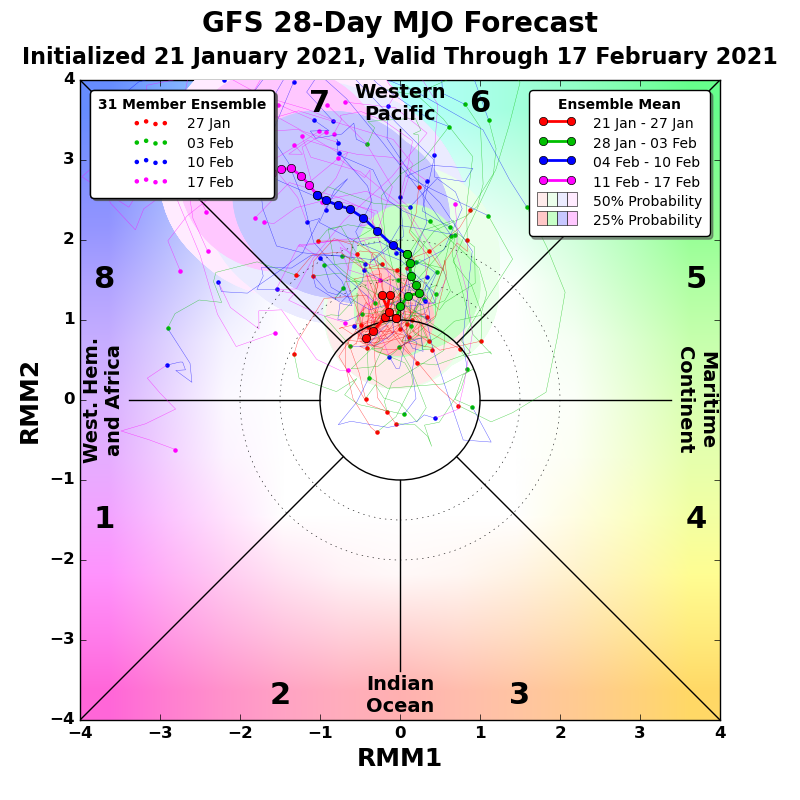
As an aside, the GEFS extended ensemble MJO forecast has been calling for an MJO transition into phases 6 and 7 for several weeks, and while the GEFS was a bit too early with this, its long-lead MJO forecast provided a major hint that disruption to the polar vortex could be long-lived.
MJO Forecast: Analog Analysis of Impacts
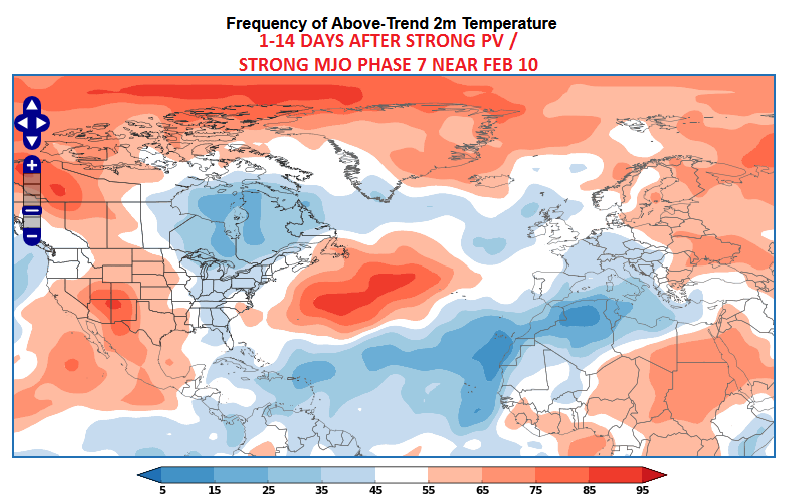
What can we say about potential impacts from this remarkable alignment of a strong MJO 6/7 pulse and an already-weak stratospheric vortex? To answer this, we glean insight from the World Climate Service subseasonal index analogs tool, which allows users to explore combinations of different climate phenomena.
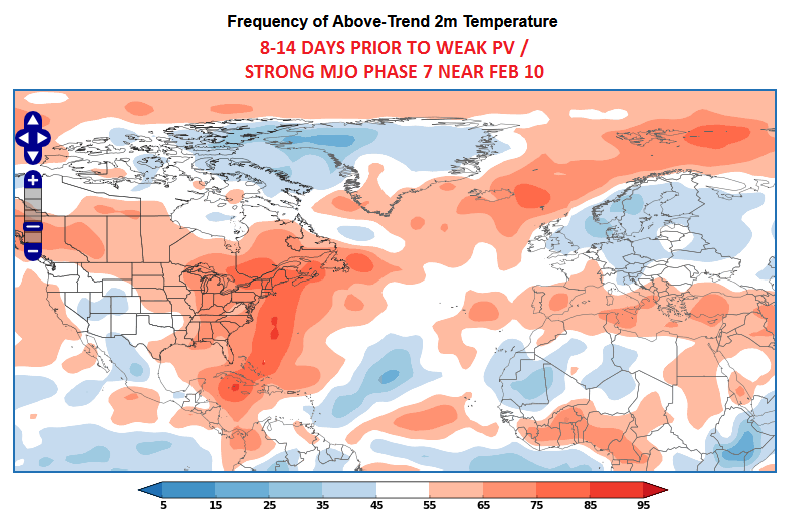
Using the WCS tool, we first search for historical dates with both a strong MJO phase 7 and a weak vortex at 10mb within two weeks either side of February 10; according to the GEFS forecast, both criteria will be satisfied on this date. A set of 11 matching historical dates are as follows: 1978/02/04, 1981/02/20, 1987/02/09, 2001/02/25, 2002/02/23, 2006/01/30, 2010/01/28, 2012/02/06, 2013/01/26, 2017/02/09, 2018/02/14.
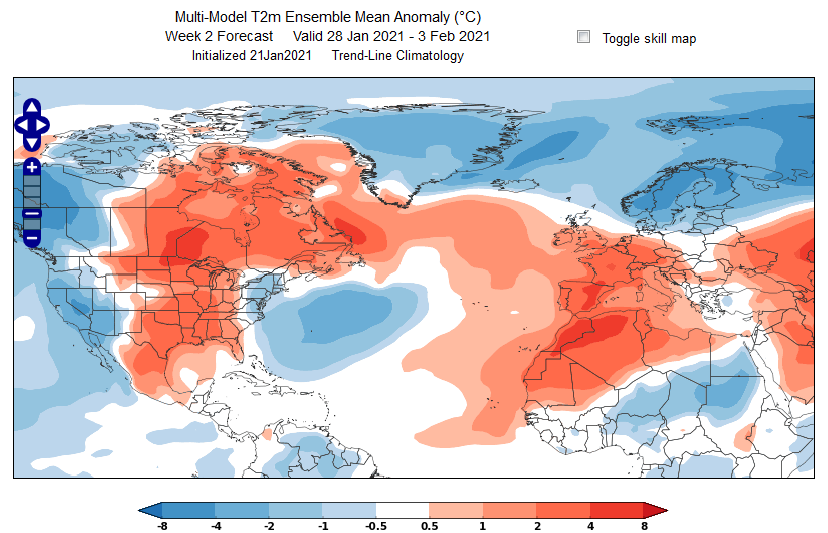
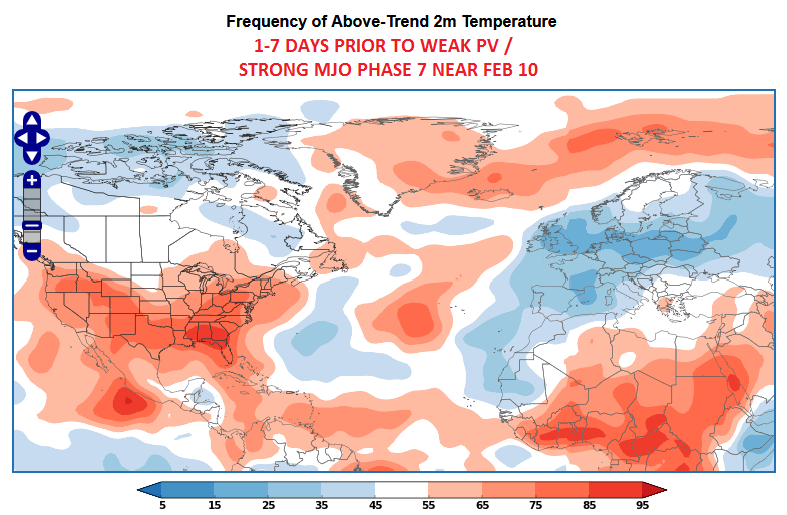
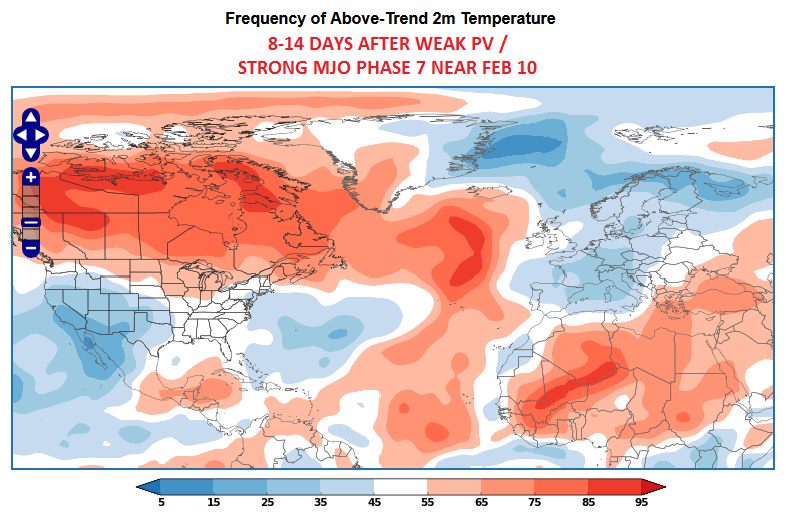
Next, we examine the temperature patterns that occurred in the weeks surrounding these analog dates. For example, 8-14 days prior to the matching dates, most of eastern North America was often warmer than normal, while Europe tended to see cold in the north and mild conditions in the south (Figure 7). This bears some resemblance to the current week 2 model forecasts (Figure 8) and suggests that the analogs do have some relevance to the current situation.
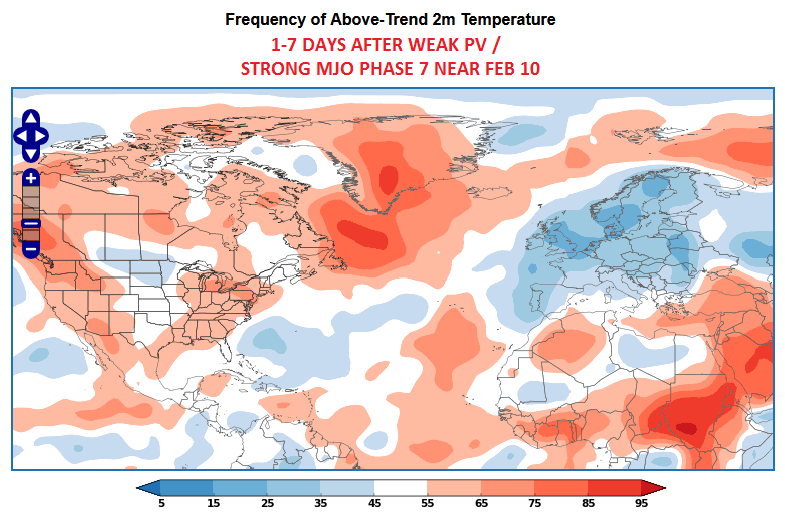
If we then step ahead week by week, the analogs reveal the typical sequence of events when the MJO/PV criteria were met at this time of year in the past. In the 7 days leading up to the matching dates, Europe tended to see a much stronger cold signal develop, with a focus on western and central areas; but warmth was dominant in the southern and eastern U.S. (Figure 9).
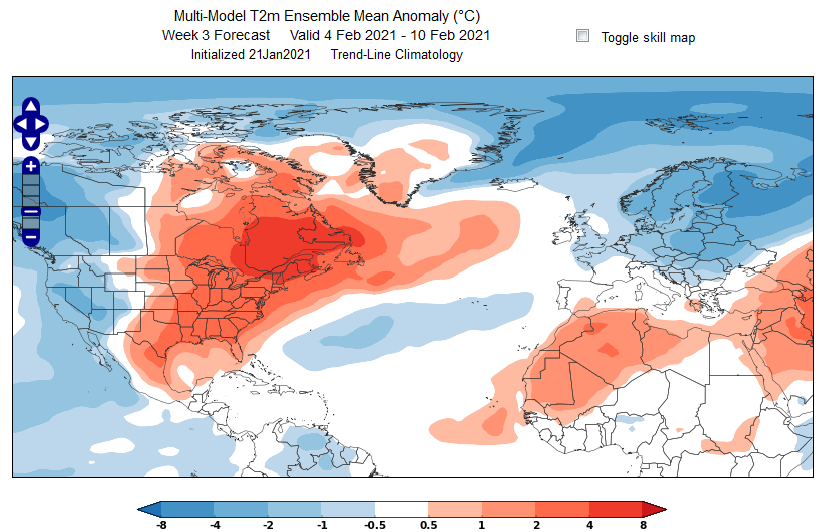
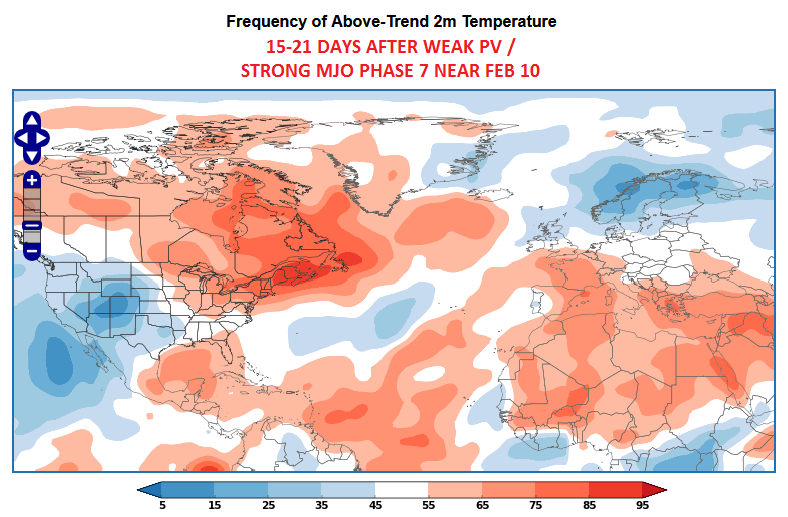
Interestingly, week 3 in the current subseasonal models (Figure 10) again shows some similarity to the analog signal, with cold expanding across Europe relative to the previous week, but with a warm signal remaining in the eastern U.S.
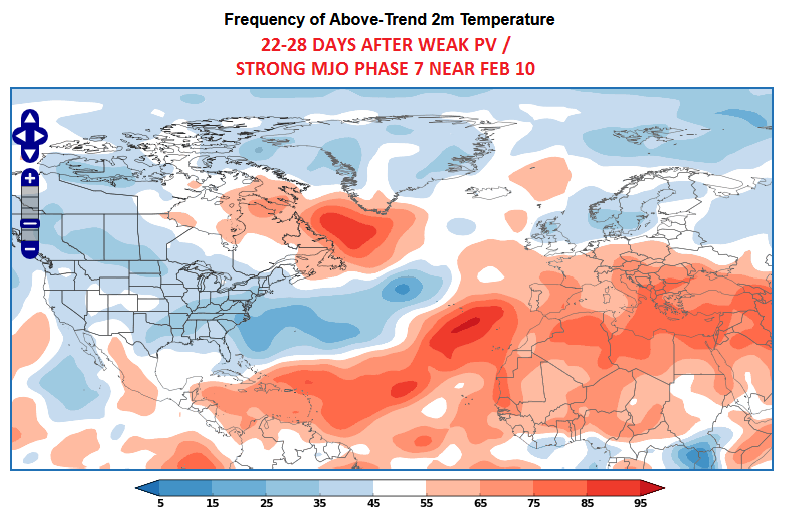
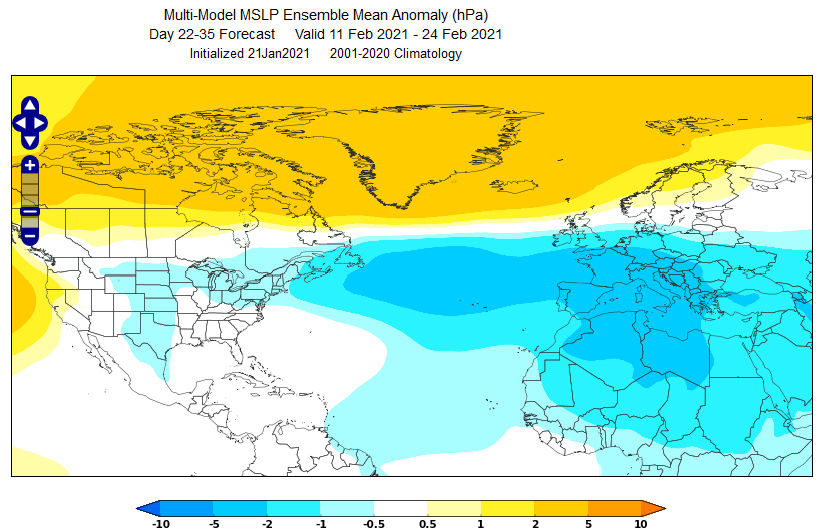
Looking beyond the February 10 matching date, the maps in figures 11, 12, 13 and 14 show the typical outcome for four more weeks, which would take us all the way to early March. Cold persists in Europe, with the signal only gradually weakening and retreating to Scandinavia, and a strong warm signal develops over Canada in the second week. Perhaps surprisingly, there is no compelling sign of cold in the eastern U.S. until week 4, i.e. early March, although the analogs see cold developing in the western U.S. in weeks 2 and 3, i.e. late February.
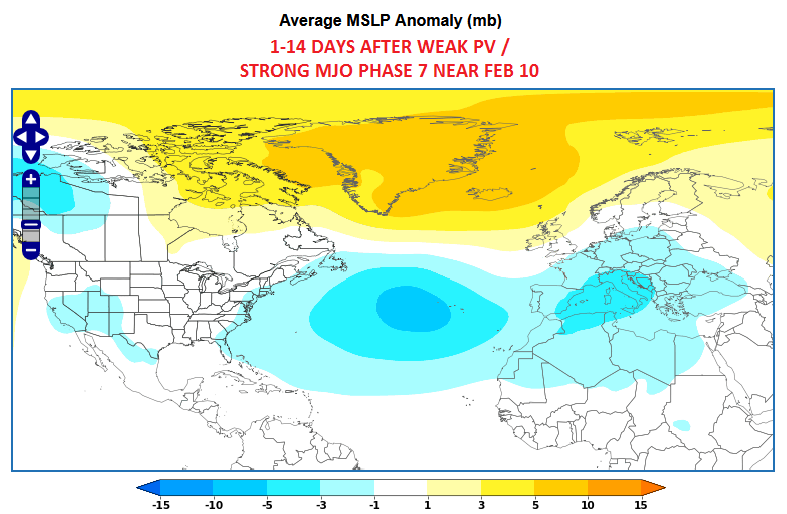
The cold signal in Europe is closely associated with a blocking ridge near Greenland and Iceland, and a southward-displaced jet stream in the North Atlantic. Again the pattern compares very favorably between the analog analysis (Figure 15) and the current model forecasts for weeks 4-5 (Figure 16).
Analog Analysis of the MJO Forecast
In summary, historical analogs suggest that the combination of a strong MJO wave in phase 7 with a weak stratospheric polar vortex is rather likely to bring widespread cold to Europe in early-mid February. This outlook is broadly similar to the dynamical model forecasts, but the analogs suggest a greater cold risk in western Europe than the models are currently indicating. In contrast, neither the analogs nor the models show any sustained or significant cold in the eastern U.S. until early March.
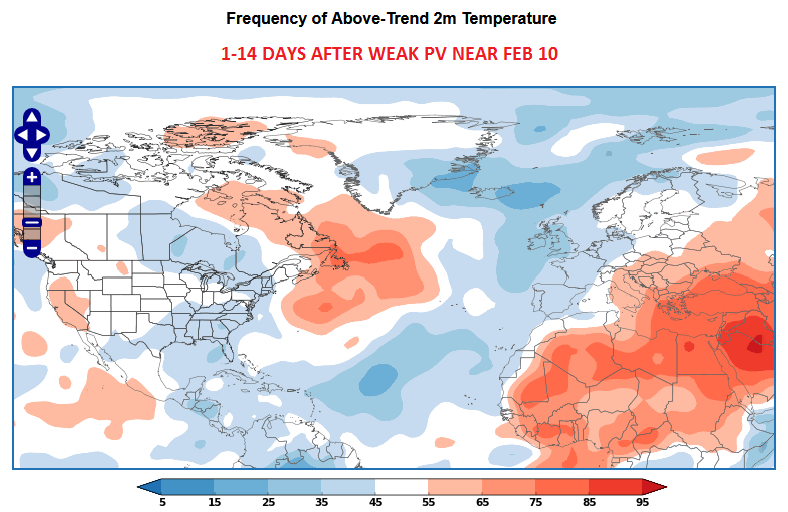
Finally – and just to illustrate further the utility of the WCS analog tool – it’s worth showing that it’s the combination of a weak polar vortex with MJO phase 7 that produces the strong cold signal for Europe. For instance, past occasions with strong MJO phase 7 and a strong polar vortex have warmth in Eastern and Northern Europe, and nearly the opposite temperature pattern in North America (Figure 17).
Alternatively, if we remove the MJO forecast criterion and only look at dates with a significantly weakened polar vortex, there’s a modest cold signal over western Europe, but it’s much less compelling than when a phase 7 MJO develops at the same time (Figure 18).
To explore these ideas in more detail, refine your own forecast process, and keep up with the MJO forecast, contact us to request a free trial of the World Climate Service subseasonal portal.