ERCOT Curtailment and Renewable Power Generation
Renewable power curtailment creates power trading opportunities because of the inducement of supply imbalances in power networks. Forecasts of curtailment days in advance can help power traders identify upcoming periods of power price volatility and find trading opportunities. This analysis examines the weather dependency of ERCOT renewable power curtailment. It also examines the possibility of using a history of ERCOT 100m wind speeds to create a renewable power curtailment forecast system to aid trading decisions.
What is Power Curtailment?
Curtailment is the intentional reduction of power generation, usually from wind, solar, or other renewable sources, below what it can sustainably produce. Curtailment is used to for grid management, market conditions, or technical constraints rather than the generator’s physical limitations. As we’ll see below, in the ERCOT market, renewable power curtailment is a function of ERCOT wind speeds.
Why Does Curtailment Happen?
- Grid Constraints: Operators must curtail generation to maintain system stability when more electricity is produced than the grid can consume or transmit.
- Supply and Demand Imbalance: If the electricity supply exceeds the demand (especially common during periods of high renewable generation and low consumption), power plants may be curtailed to prevent grid overload.
- Market Conditions: In some cases, curtailment occurs due to market signals, such as low or negative electricity prices, making it economically unfeasible to continue generating power.
- Technical Issues: Maintenance, transmission line congestion, or other grid reliability issues can lead to curtailment.
Curtailment and Power Trading
Curtailment has important implications for power trading. Power prices are generally depressed during curtailment because power supply exceeds demand. Power price volatility also increases during curtailment periods, creating power trading opportunities.
Forecasts of curtailment several days ahead enable a power trader to anticipate periods of reduced power prices and increase intra-day price volatility.
ERCOT Power Curtailment
ERCOT does not release an ERCOT curtailment report. However, ERCOT curtailment can be inferred from data released in their 60-day delayed Security-Constrained Economic Dispatch (SCED) report.
Two pieces of information in the ERCOT SCED report are necessary to calculate curtailment. This information is available for each ERCOT-registered power-generating resource for each hour of the reported day. The data points are:
- Base Point: the power output level that ERCOT instructs a generator to produce.
- High Sustained Limit (HSL): the maximum capacity a generator can produce at a given time
If the power generation asset is instructed to produce less than its high sustained limit, the power source is curtailed.
Curtailment Calculation
The base point and HSL data is provided by ERCOT. We accessed the available history of this hourly data and aggregated it to daily resolution.
The calculation of curtailment is simple.
Curtailment = HSL – Base Point.
This statistic is calculated from data within the SCED reports and aggregated by day and power source type (i.e., wind or solar power).
The curtailment statistics can be compared to other available market information. For example, we examined curtailment as a percentage of total daily available renewable power production and ERCOT system load (i.e., power demand).
ERCOT Renewable Power Curtailment History
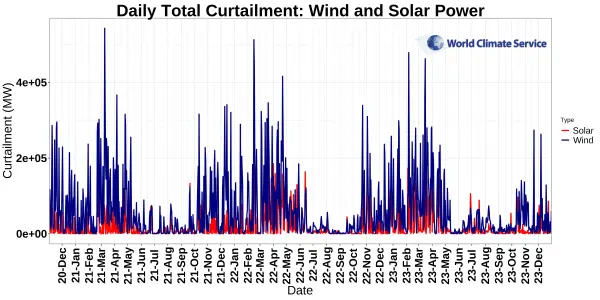
Daily wind and solar power curtailment data from 2021 to 2023 are calculated. The data shows little curtailment is required during the summer months. However, curtailment is quite prevalent from October to May each year.
ERCOT Curtailment Relative to Renewable Power Generation
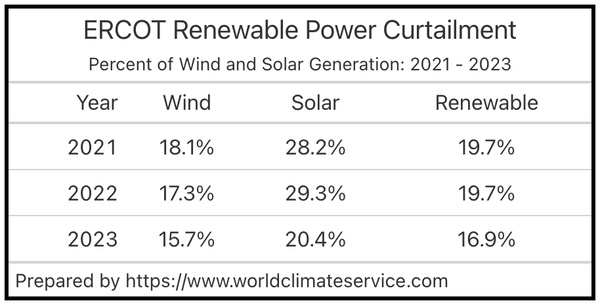
We summarize curtailment as a percentage of total available renewable power generation in Table 1 and Table 2.
ERCOT Curtailment Relative to ERCOT Load
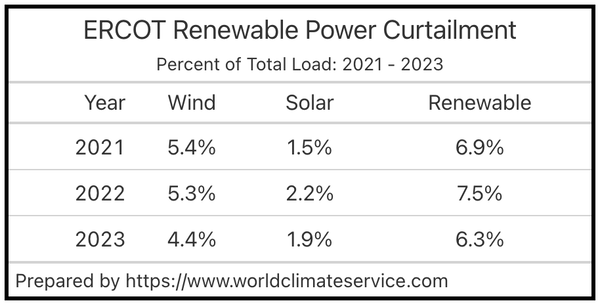
We also summarize curtailment as a percentage of the ERCOT system load.
Weather Dependent ERCOT Curtailment
Is curtailment weather-dependent? To answer this question, we draw upon a World Climate Service-created data set of daily ERCOT wind power capacity weighted wind speeds and solar power capacity weighted solar radiation. When combined with the data provided by the ERCOT SCED report, the data set enables analysis of renewable power trends with ERCOT.
An analysis not shown here demonstrates a dependency of curtailment on ERCOT wind power capacity 100m wind speeds but not solar radiation. We examine this dependency with a “bin-bin” analysis.
Both the daily averaged ERCOT wind power production weighted wind speeds and daily accumulated ERCOT system-wide loads were separated into bins. The wind bins are one mph wide. The daily load bins are 1M MW wide. All weather and load observations are allocated to a bin based on their value. The estimated curtailment as a percentage of total available renewable generation and ERCOT systemwide load is then calculated for each wind, load, and wind & load bins. The results are below.
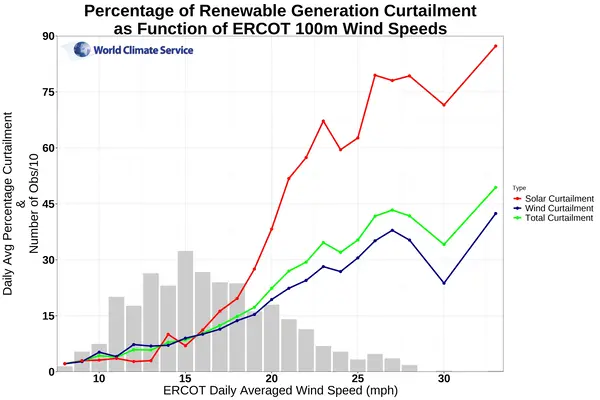
Figure 2 shows the ERCOT renewable power curtailment dependency as a function of ERCOT wind power capacity weighted wind speeds. The data demonstrates that renewable power curtailment increases with wind speed. This occurs because greater wind power is generated at higher wind speeds. In addition, solar curtailment is substantially increased during periods of increased wind speeds.
Load Dependent ERCOT Curtailment
Is curtailment ERCOT system-wide load dependent? The weather-dependent curtailment analysis above shows that high winds are related to increased rates of renewable curtailment.
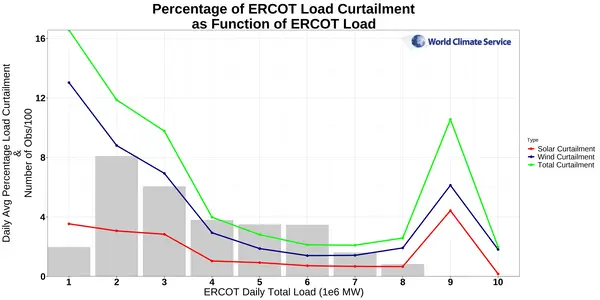
Figure 3 below shows the relationship between ERCOT daily accumulated load and renewable power curtailment by type of renewable power. Wind and power curtailment are relatively high for low daily total loads but decrease substantially by daily total loads of 4M MW.
The grey columns indicate the relative frequency of the daily total load. The lower end of the daily load scale is more frequent than the greater end of the daily load spectrum. The increase in curtailment for daily load in the 9M MW bin is likely sampling error-related. There is only one day in that bin, which means the curtailment estimate is likely unstable.
Weather and Load Dependent Curtailment
Since renewable curtailment is both weather—and load-dependent, it’s logical to examine the curtailment impact considering both factors. Our analysis combines the weather and load bin analysis, which is shown below.
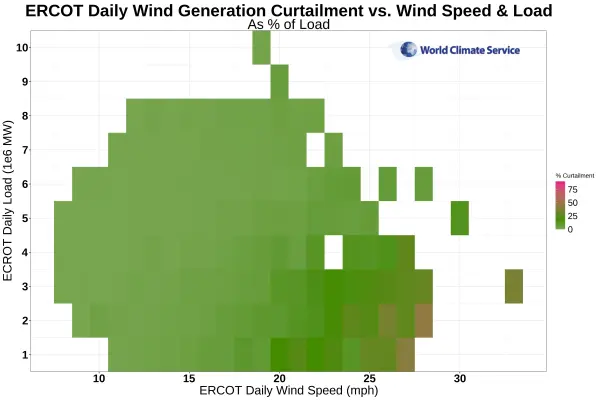
The wind and load-dependent curtailment as a percentage of total load shown in Figure 4 indicates that wind curtailment rates relative to ERCOT system wind load increases near wind speeds of 20 MPH at relatively low daily loads. Maximum curtailment occurs at maximum wind speeds and minimum loads.
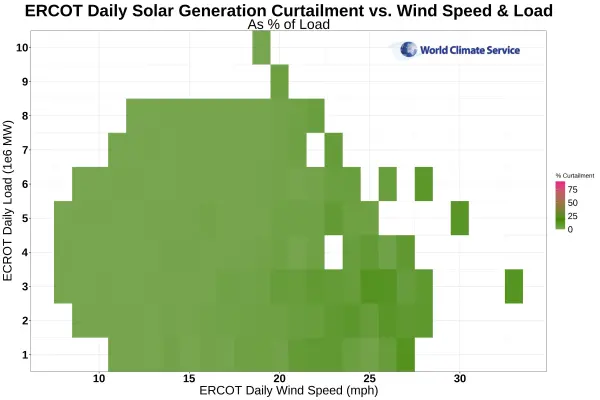
Figure 5 shows the ERCOT solar power curtailment relative to the daily ERCOT system load for daily wind speeds and ERCOT daily load. The curtailment percentage is less than for solar but does increase at minimum loads and maximum wind speeds.
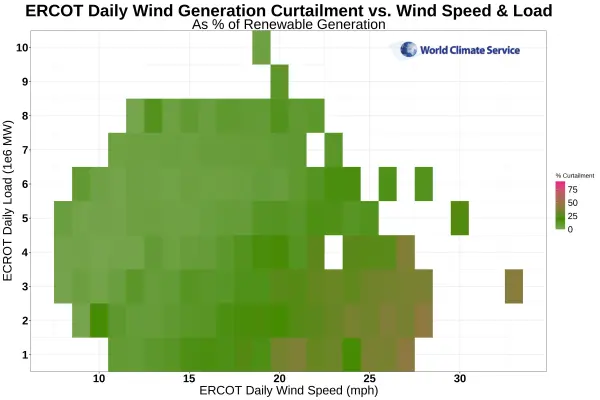
Curtailment as a percentage of total available renewable power is more significant. Figure 6 shows the percentage of daily wind power curtailment relative to total available renewable power generation as a function of the wind speed and daily accumulated load bind. At maximum wind speeds and minimum loads the curtailment percentage increases to near 50%.
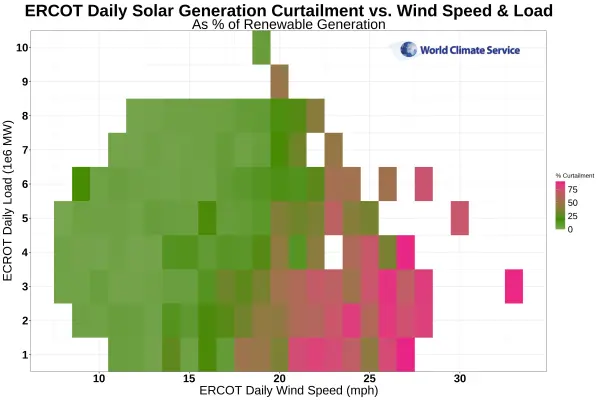
Likewise, the daily solar power curtailment shown in Figure 7 increases to as much as 75% during low load and high wind speeds. ERCOT is deciding to substantially curtail solar power generation when the renewable power supply is high relative to the electricity demand.
Curtailment and Power Trading
This analysis shows that renewable power curtailment is more likely when the ERCOT systemwide load is relatively low and ERCOT wind power capacity weighted wind speeds are elevated. Knowledge of the likelihood of curtailment scenarios helps power traders improve their profitability.
Knowing when curtailment will likely occur will help with power trading strategies related to periods of supply constraints, negative pricing threats, and even location marginal price spike scenarios. Power traders can be properly positioned to profit from these times of power price volatility.
This analysis suggests that a history of ERCOT solar radiation and wind speed forecasts would enable a thorough analysis of the likelihood of ERCOT curtailment. In other words, a curtailment prediction system can be created using the relationships determined in this analysis and a history of weather forecast information.